Serologic Evidence of Exposure to Highly Pathogenic Avian Influenza H5 Viruses in Migratory Shorebirds, Australia
Michelle Wille

, Simeon Lisovski, Alice Risely, Marta Ferenczi, David Roshier, Frank Y.K. Wong, Andrew C. Breed, Marcel Klaassen, and Aeron C. Hurt
Author affiliations: World Health Organization Collaborating Centre for Reference and Research on Influenza, Melbourne, Victoria, Australia (M. Wille, A.C. Hurt); Deakin University, Geelong, Victoria, Australia (S. Lisovski, A. Risely, M. Ferenczi, D. Roshier, M. Klaassen); Commonwealth Scientific and Industrial Research Organisation, Australian Animal Health Laboratory, Geelong (F.Y.K. Wong); Department of Agriculture and Water Resources, Canberra, Capital Territory, Australia (A.C. Breed); University of Queensland, St. Lucia, Queensland, Australia (A.C. Breed)
Main Article
Figure 1
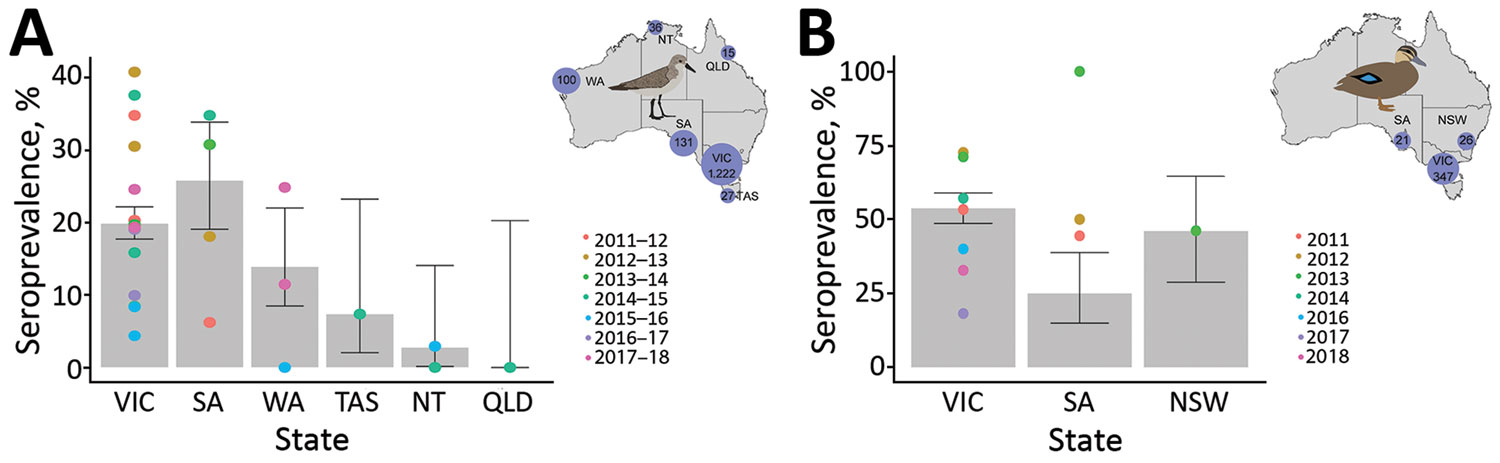
Figure 1. Seroprevalence for nucleoprotein antibodies in red-necked stints and Pacific black ducks, Australia, 2011–2018. A) For red-necked stint, year represents the austral summer period, October–April, when this species has a migratory nonbreeding stopover in Australia. B) For Pacific black duck, year represents calendar year. (No samples were collected in 2015.) Inset maps show the number of samples collected from each species in each state over the course of this study. Error bars represent seroprevalence 95% CIs for each state across all years; color dots represent estimates of seroprevalence at each sampling occasion. NSW, New South Wales; NT, Northern Territory; QLD, Queensland; SA, South Australia; TAS, Tasmania; VIC, Victoria; WA, Western Australia.
Main Article
Page created: September 17, 2019
Page updated: September 17, 2019
Page reviewed: September 17, 2019
The conclusions, findings, and opinions expressed by authors contributing to this journal do not necessarily reflect the official position of the U.S. Department of Health and Human Services, the Public Health Service, the Centers for Disease Control and Prevention, or the authors' affiliated institutions. Use of trade names is for identification only and does not imply endorsement by any of the groups named above.