Epidemiologic, Entomologic, and Virologic Factors of the 2014–15 Ross River Virus Outbreak, Queensland, Australia
Cassie C. Jansen, Martin A. Shivas, Fiona J. May, Alyssa T. Pyke, Michael B. Onn, Kerryn Lodo, Sonja Hall-Mendelin, Jamie L. McMahon, Brian L. Montgomery, Jonathan M. Darbro, Stephen L. Doggett, and Andrew F. van den Hurk

Author affiliations: Communicable Diseases Branch, Queensland Government Department of Health, Herston, Queensland, Australia (C.C. Jansen, K. Lodo); Brisbane City Council, Fortitude Valley, Queensland, Australia (M.A. Shivas, M.B. Onn); Metro North Hospital and Health Service, Windsor, Queensland, Australia (F.J. May); Forensic and Scientific Services, Queensland Government Department of Health, Coopers Plains, Queensland, Australia (A.T. Pyke, S. Hall-Mendelin, J.L. McMahon, A.F. van den Hurk); Metro South Hospital and Health Service, Coopers Plains (B.L. Montgomery); Queensland Institute of Medical Research Berghofer, Herston (J.M. Darbro); University of Sydney and Westmead Hospital, Sydney, New South Wales, Australia (S.L. Doggett)
Main Article
Figure 4
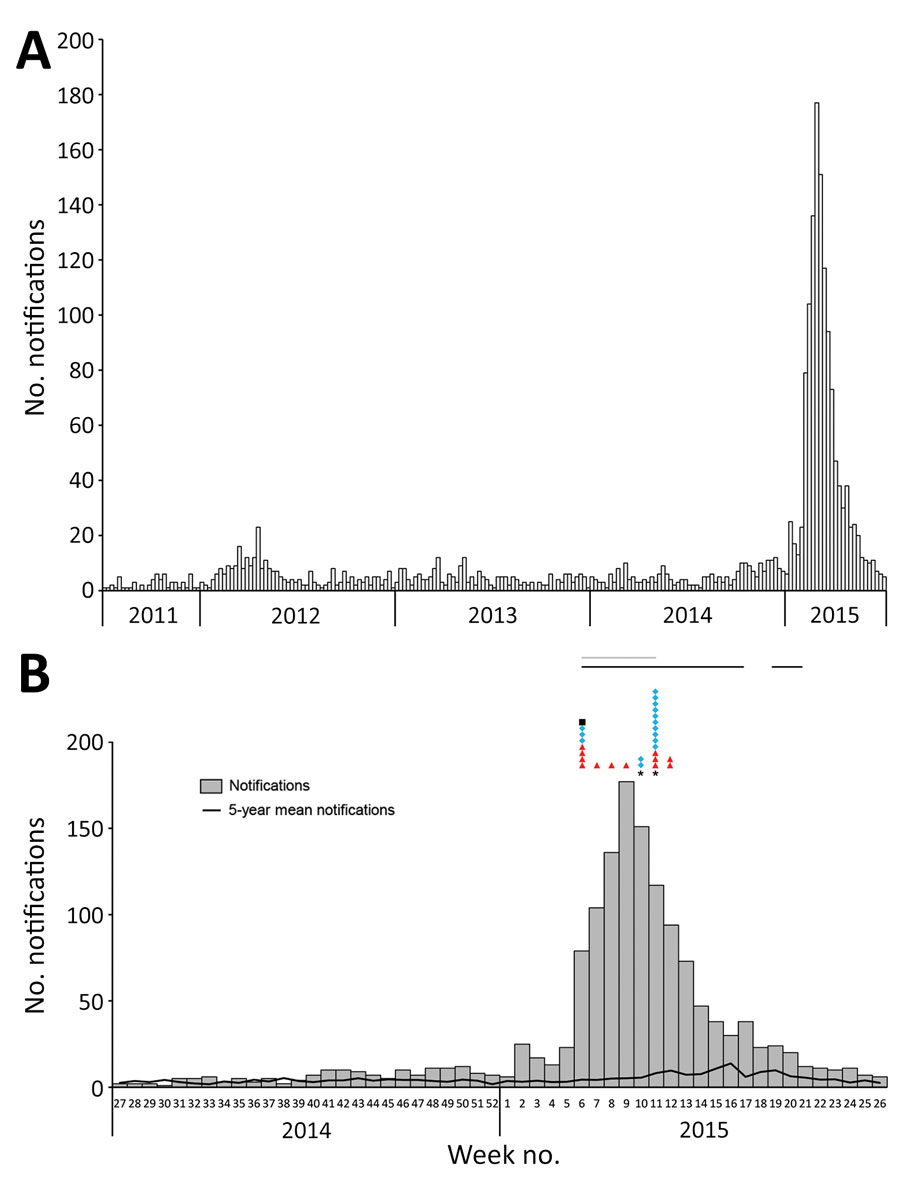
Figure 4. Ross River virus (RRV) notifications by week, Brisbane local government area, Queensland, Australia, July 1, 2011–June 30, 2015 (A), and July 1, 2014–June 30, 2015 (B). Symbols in panel B represent single detection events: red triangles, RRV RNA detection from Flinders Technology Associates cards by real-time reverse transcription PCR; blue diamonds, RRV RNA detection from mosquito pools by real-time reverse transcription PCR; and black square, RRV detection from mosquito pools by cell culture ELISA. Also in panel B, the black line above the graph indicates when Flinders Technology Associates cards were deployed and gray line when mosquito pools were being collected and screened for RRV infection. Mosquitoes acquired from traps in weeks 10 and 11 were damaged by rain; thus, RRV-positive mosquito parts might have stuck to RRV-negative mosquitoes and turned some pools artificially positive.
Main Article
Page created: November 18, 2019
Page updated: November 18, 2019
Page reviewed: November 18, 2019
The conclusions, findings, and opinions expressed by authors contributing to this journal do not necessarily reflect the official position of the U.S. Department of Health and Human Services, the Public Health Service, the Centers for Disease Control and Prevention, or the authors' affiliated institutions. Use of trade names is for identification only and does not imply endorsement by any of the groups named above.