Skip directly to site content Skip directly to page options Skip directly to A-Z link Skip directly to A-Z link Skip directly to A-Z link
Volume 26, Number 6—June 2020
Dispatch

Origin of 3 Rabid Terrestrial Animals in Raccoon Rabies Virus–Free Zone, Long Island, New York, USA, 2016–2017

Scott BruntComments to Author , Heather Solomon, Hilaire Leavitt, Erica Lasek-Nesselquist, Pascal LaPierre, Matt Shudt, Laura Bigler, Navjot Singh, and April D. Davis
Author affiliations: New York State Department of Health, Albany, New York, USA (S. Brunt, H. Solomon, E. Lasek-Nesselquist, P. LaPierre, M. Shudt, N. Singh, A.D. Davis); Connecticut Department of Health, Rocky Hill, Connecticut, USA (H. Leavitt); Cornell University, Ithaca, New York, USA (L. Bigler)

Main Article

Figure 2

Maximum-likelihood whole-genome phylogeny and geographic location of rabies virus variants, northeastern United States and Canada, 2016–2017, including the rabid raccoon (green triangle), river otter (green diamond), and cat (purple square) found in raccoon rabies virus–free zones, Nassau and Suffolk Counties, Long Island, New York, USA . A) Midpoint-rooted, maximum-likelihood sequence analysis depicts the relationships among variants collected from New York, New Jersey, Massachusetts, Connectic

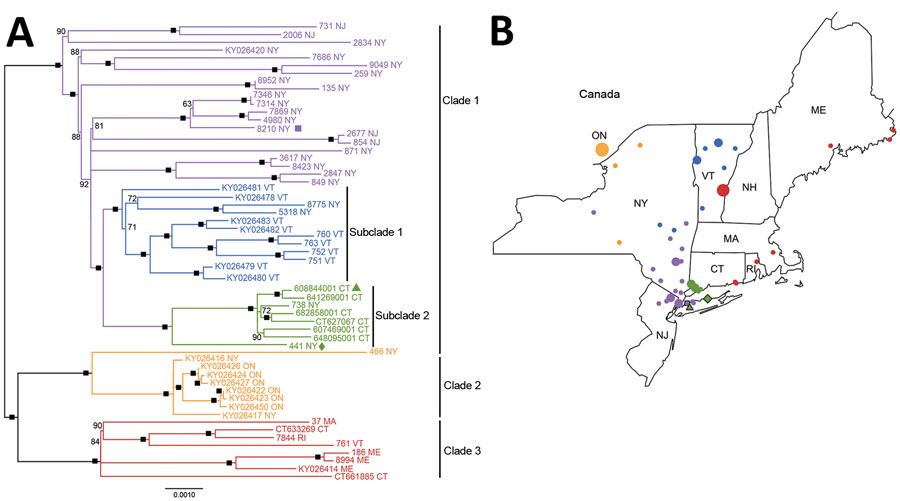
Figure 2. Maximum-likelihood whole-genome phylogeny and geographic location of rabies virus variants, northeastern United States and Canada, 2016–2017, including the rabid raccoon (green triangle), river otter (green diamond), and cat (purple square) found in raccoon rabies virus–free zones, Nassau and Suffolk Counties, Long Island, New York, USA . A) Midpoint-rooted, maximum-likelihood sequence analysis depicts the relationships among variants collected from New York, New Jersey, Massachusetts, Connecticut, Rhode Island, Vermont, and Maine, USA, and Ontario, Canada. Black boxes indicate nodes with >95% bootstrap support. Bootstrap support <50% is not shown. Scale bar indicates nucleotide substitutions per site. B) Location (by county) of virus isolation. Colors represent the major clades or subclades depicted in tree, and the size of symbols is proportional to the number of rabies samples isolated in that county. ON, Ontario.

Main Article

Page created: May 19, 2020
Page updated: May 19, 2020
Page reviewed: May 19, 2020
The conclusions, findings, and opinions expressed by authors contributing to this journal do not necessarily reflect the official position of the U.S. Department of Health and Human Services, the Public Health Service, the Centers for Disease Control and Prevention, or the authors' affiliated institutions. Use of trade names is for identification only and does not imply endorsement by any of the groups named above.
file_external