Volume 27, Number 4—April 2021
Research
Dynamic Public Perceptions of the Coronavirus Disease Crisis, the Netherlands, 2020
Abstract
A key component of outbreak control is monitoring public perceptions and public response. To determine public perceptions and public responses during the first 3 months of the coronavirus disease (COVID-19) outbreak in the Netherlands, we conducted 6 repeated surveys of ≈3,000 persons. Generalized estimating equations analyses revealed changes over time as well as differences between groups at low and high risk. Overall, respondents perceived the risks associated with COVID-19 to be considerable, were positive about the mitigation measures, trusted the information and the measures from authorities, and adopted protective measures. Substantial increases were observed in risk perceptions and self-reported protective behavior in the first weeks of the outbreak. Individual differences were based mainly on participants’ age and health condition. We recommend that authorities constantly adjust their COVID-19 communication and mitigation strategies to fit public perceptions and public responses and that they tailor the information for different groups.
Since December 2019, the world has been facing a new and severe threat to public health. Severe acute respiratory syndrome coronavirus 2 (SARS-CoV-2), which causes mild to severe respiratory illness (coronavirus disease [COVID-19]), was first found in humans in Wuhan, China (1). The virus spread rapidly over the world, and on March 11, 2020, the World Health Organization declared a COVID-19 pandemic (2). Globally, by January 23, 2021, a total of 96,877,399 cases had been confirmed, including 2,098,879 deaths (3). The risks associated with COVID-19 are not equally distributed; some regions (within and between countries) are more strongly affected than others, health workers are at increased risk for infection, and elderly persons with certain chronic underlying conditions and men are at increased risk for severe COVID-19 illness and death (4).
During the COVID-19 pandemic, countries all over the world rapidly adopted various measures to counter the spread of the virus. In the initial (containment) stage, the measures were aimed at identifying and isolating new cases. As the number of cases started to rise quickly, countries announced additional social distancing measures. Many countries undertook stringent mitigation measures, such as closing schools and restaurants, restraining domestic and foreign travel, and, for some, implementing a total lockdown of the society (5). For these measures to be effective, governments rely strongly on the support and compliance of the general public.
To maintain support for the protective measures for a longer period, governments need insights into the dynamics of public perceptions (regarding the risks associated with COVID-19 and the recommended protective measures) and the trust in the authorities who imposed these measures. These perceptions and trust influence the public’s compliance with the measures (6) and are essential indicators for public sentiments and information needs. Such insights enable optimal adaptation and tailoring of risk and crisis communication (7–10). The first publications about public perceptions of and responses to the COVID-19 pandemic are, to our knowledge, all cross-sectional and do not provide insights into the dynamics (11–19). Previous studies about the 2009 influenza A(H1N1) pandemic showed considerable changes in, among other things, perceptions of risk, trust in authorities, and self-reported protective behavior over a longer crisis period (20–25).
Figure 1
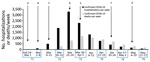
Figure 1. Course of COVID-19 in the Netherlands, February 24–May 17, 2020. COVID-19 hospitalizations and deaths are shown by week (data from https://www.rivm.nl/coronavirus-covid-19/grafieken). Blue boxes labeled T1–T6 along baseline indicate...
Our study focused on public perceptions, trust, and behavior in the first 3 months of the COVID-19 crisis in the Netherlands. Our main research question asked about the evolution of public perceptions of COVID-19, perceptions of control measures, trust in authorities, and self-reported protective behavior between the onset of the outbreak and the first relaxations of government measures. We discuss these findings in light of the epidemiologic curve of COVID-19 in the Netherlands and the government outbreak response during February–May 2020 (Figure 1). In addition, we explored differences in perceptions, trust, and self-reported behavior between groups of persons at different levels of risk. Therefore, our second research question asked whether persons differ in their perceptions of COVID-19, perceptions of the control measures, trust in authorities, and self-reported protective behavior on the basis of their age, sex, region of residence, health condition, and health sector employment.
Case Study
The first COVID-19 case in the Netherlands was identified on February 27, 2020 (26). In the following weeks, the number of confirmed cases increased rapidly (27,28) and the number of cases between regions differed considerably. The 12 provinces in the Netherlands can be roughly divided into 4 regions: north, east, south, and west. Through May 17, the region most strongly affected by the COVID-19 outbreak was the southern region (58–63 deaths/100,000 residents), especially compared with the northern region (3–9 deaths/100,000 residents). The eastern region reported 19–31 deaths/100,000 residents and the western region 16–30 deaths/100,000 residents (29).
After the first case of COVID-19 was reported, the government issued various measures that increased in stringency through March 23, 2020. When a sustained decrease in the number of cases, hospitalizations, and deaths was reached (May 11, 2020), the government gradually relaxed measures (Figure 1).
Study Population and Procedure
We conducted 6 repeated online surveys among members of the Dutch Health Care Consumer Panel (30). The panel consists of ≈11,000 residents of the Netherlands (>18 years of age) who had been invited to participate on the panel on the basis of a random selection of name and address data or were invited to participate by their general practitioner. The panel population is regularly renewed, and persons cannot enroll themselves without an invitation. As a result of oversampling of persons >65 years of age for other research purposes and underparticipation of persons <30 years of age, the median age of the panel population is 65 years (range 19–101 years).
The 6 repeated surveys were added to a weekly online survey that monitors influenza-like symptoms. The invitations for the first survey (time 1 [T1]) of the weekly monitor was sent to all 10,993 active panel members, who could complete the survey from February 24 through March 9, 2020. In the first survey, respondents could indicate whether they wanted to be invited for the consequent weekly surveys; those who indicated “yes” received a weekly invitation for all follow-up surveys. Participation in each survey was voluntary and did not depend on participation in previous surveys. The follow-up surveys with the variables addressed in this study were completed during March 16–23 (T2), March 30–April 5 (T3), April 14–19 (T4), April 28–May 3 (T5), and May 11–17 (T6) (Figure 1).
Before joining the panel population, potential panel members actively consented to participation and data sharing; they were informed about the purpose and content of the survey and that they could skip questions or stop participating at any time. Completing the survey, including answering questions about influenza-like symptoms, took an average of 8 minutes. The Clinical Expertise Centre at the National Institute for Public Health and the Environment (RIVM; Bilthoven, the Netherlands) determined that this research was exempt from needing further approval from an ethics research committee (reference no. LCI-451). The gathered data were analyzed and processed according the General Data Protection Regulation. More elaborate descriptions of the data collection are published elsewhere (31) and provided in the Appendix.
Variables
The survey questions addressed public perceptions of COVID-19, perceptions of control measures, trust in authorities, and self-reported protective behavior. The T3 survey and subsequent surveys were supplemented with extra questions about control measures and about trust in authorities (Table 1).
The factors that put persons at increased risk for COVID-19 were operationalized as sex (male/female), age group (<50, 50–69, or >70 years of age), region of residence (north, east, west, south; variable determined on the basis of postal codes), employment in healthcare (assessed at T1 with the question “Do you currently work in the healthcare sector?: no/yes”), and underlying health condition [assessed at T1 with the question “Please mark the disease(s) or condition(s) you have below. (Multiple answers possible): A) chronic respiratory disease; B) serious heart disease or myocardial infarction; C) diabetes; D) an allergy such as hay fever, dust mite allergy, or pet allergy; E) other long-term or chronic condition, namely: … F). I don't have any diseases or conditions).”]. The last variable was recoded as “underlying health condition” if respondents answered A, B, C, or E; all others were coded as “no underlying health condition.”
Analyses
We computed descriptive statistics for each variable in T1–T6 (Table 1). To study changes over time and differences between persons in these variables, we performed generalized estimating equation (GEE) analyses (with exchangeable correlation matrix). We performed linear (for dependent variables with a 5-point Likert scale) and logistic (for dependent variables with binary outcomes) GEE analyses. The independent variables were time (T1–T6), sex, age group, region of residence, underlying health condition, and employment in healthcare. All GEE analyses were controlled for education level and income. To observe all changes between the subsequent waves, we repeated all GEE analyses with different reference groups for time (T1, T3, and T5). We excluded from analysis respondents who participated in T1 but did not consent to be invited to participate in the follow-up surveys.
Study Population
Of the 10,993 persons invited to participate, 4,325 (39%) completed the first survey. Of note, 2,052 respondents completed the first survey before February 27, 2020 (when the first COVID-19 case in the Netherlands was confirmed). A total of 3,268 (30%) consented to be invited for the follow-up surveys, of which 2,592 participated in T2 (79%), 2,710 in T3 (83%), 2,726 in T4 (83%), 2,654 in T5 (81%), and 2,705 in T6 (83%) (33) (Table 2; Appendix).
Perceptions of COVID-19
Figure 2
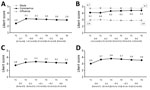
Figure 2. Perceptions of COVID-19 in the Netherlands. A) Perceived probability of COVID-19; B) perceived severity of influenza, coronavirus disease, Ebola; C) concerns about own heath; D) concerns about health of family...
Overall, respondents perceived acquiring COVID-19 as probable and considerably severe (Figure 2). The perceived severity of COVID-19 was more similar to that of Ebola than that of influenza. Concerns about their own health were substantial, and concerns about the health of family members were even more so.
The most considerable change in the perceptions of COVID-19 was seen between T1 and T2; the mean perceived probability of COVID-19, concerns about one’s own health, and concerns about family members increased considerably. Perceived severity of COVID-19 increased (significantly) only between T2 and T3. Between T3 and T6, perceptions of COVID-19 were largely stable, except for a slight but significant decrease in concerns.
Perceptions of Control Measures
Figure 3
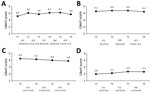
Figure 3. Perceptions of coronavirus disease control measures in the Netherlands. A) Sufficient measures are taken; B) measures are effective; C) most others adhere to measures; D) difficult to adhere to measures....
Overall, respondents thought that the Netherlands undertook sufficient measures to control the spread of COVID-19, perceived the recommended measures as effective, thought that most others adhered to the measures, and did not perceive adhering to the measures as difficult (Figure 3). The perception that the Netherlands was taking sufficient measures changed nonlinearly between T1 and T6. Perception of measure effectiveness followed a pattern similar to the perception that sufficient measures were taken; it slightly increased between T3 and T4 and slightly decreased between T5 and T6. The perception that most others adhere to the measures decreased gradually between T3 and T6, and the perceived difficulty of adhering to the measures increased slightly between T3 and T5.
Trust in Authorities
Figure 4
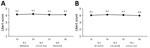
Figure 4. Trust in authorities in the Netherlands. A) Trust information from National Institute for Public Health and the Environment (RIVM), Bilthoven, the Netherlands; B) trust government measures. Mean values per survey...
Overall, trust in the information from RIVM and in the measures taken by the government was fairly high (Figure 4). A slight decrease in trust in the information from RIVM was observed between T4 and T5. Trust in the measures from the government slightly increased between T3 and T4 and slightly decreased between T5 and T6.
Self-Reported Protective Behavior
Figure 5

Figure 5. Self-reported coronavirus disease protective behavior in the Netherlands. A) Self-reported protective measures taken; B) self-reported adherence to guidelines. Mean values per survey are shown above the graph line. Note that...
From T1 through T2, the proportion of respondents who indicated that they took measures to protect themselves or their family members against SARS-CoV-2 increased drastically, from 17% to 79% (Figure 5). From T2 through T3, this percentage increased further, to 88%, and consequently decreased to 80% at T6. Likewise, from T3 through T6, the proportion of respondents who indicated that they (fully) adhered to the recommended guidelines declined gradually from 94% to 85%.
Differences Based on Risk Factors
The most notable differences between persons in terms of perceptions (Tables 3, 4), trust in authorities (Table 5), and self-reported protective behavior (Table 6) were based on age. Compared with persons <50 years of age, those 50–69 and >70 years of age perceived acquisition of COVID-19 as being less probable and COVID-19 as more severe and were more concerned about their own health. In addition, respondents >70 years of age were also more likely to perceive the government’s measures as sufficient, effective, and adhered to by most others and were less likely to perceive adhering to the measures as difficult. That difference in perceived difficulty was also observed for those 50–69 compared with those <50 years of age. Participants >70 years of age also experienced more trust in authorities and were more likely to adhere to the guidelines.
We observed several differences between respondents with and without an underlying health condition. Respondents with an underlying health condition perceived acquisition of COVID-19 as being more probable and COVID-19 as being more severe, and they were more concerned about their own health and that of family members. These respondents also perceived that measures taken were less sufficient, had less trust in authorities, and were slightly more likely to have adopted protective measures.
Some additional small differences were observed on the basis of sex, region, and employment. Women perceived the probability of acquiring and severity of COVD-19 as being somewhat greater than did men and were slightly more concerned about family members. In addition, women were somewhat more positive about the measures (sufficient, effective, and adhered to by others) and were more likely to have adopted protective measures. Compared with residents from the northern region of the Netherlands, residents from the southern region were slightly more concerned about their own health, and residents from the eastern region had somewhat more trust in authorities. The only difference based on employment in the healthcare sector was seen in perceived probability of a SARS-CoV-2 infection (slightly higher among healthcare workers).
Our results suggest that during the first wave of COVID-19, persons in the Netherlands generally perceived the risks posed by COVID-19 as considerable, were positive about the measures taken by the government to control the spread of COVID-19, trusted the information and the measures from the authorities in charge of the control policy, and adopted protective behavior. Public perceptions and behavior changed between the onset of the crisis and the initial relaxation of measures, particularly in the first phase of the outbreak. Differences between persons were mostly seen on the basis of age and underlying health conditions.
The changes in public perceptions, trust, and behavior need to be interpreted in light of the rapid developments in the epidemiologic curve of COVID-19 and the outbreak response during this study (Figure 1). After the first confirmed COVID-19 case (February 27, 2020), the outbreak unfolded rapidly and stringent control measures were issued during live press conferences on national television (March 12 and 15). These developments are probably reflected in the observed increases in the respondents’ perceived probability of acquiring COVID-19, concerns, and self-reported protective behavior in this period. Up to the end of March/beginning of April, the number of COVID-19 cases rose rapidly, as did the number of hospitalizations, intensive care unit admissions, and deaths. The increased visibility of severe COVID-19 illness and death during this period might have increased perceptions of severity (which had remained stable in the first weeks).
As the number of cases, hospitalizations, intensive care unit admissions, and deaths gradually declined at the beginning of May, the government announced gradual relaxations of the control measures. During this period, the number of respondents who reported having taken protective measures and adhered to the recommended guidelines declined. This change in protective behavior is not likely to be explained by a change in risk perception, perception of the efficacy of the measures, or trust in authorities (factors shown to influence behavior during disease outbreaks [6,9,13]) because these factors were stable during this period. This change in behavior might be partly explained by a decrease in the public’s perceived self-efficacy (6,34) because during this period we observed an increase in the public’s perceived difficulty of adhering to the measures.
More recent research in the Netherlands has shown that in the months after our study, persons perceived it to be increasingly difficult to adhere to several of the control measures (35). Although the perceived difficulty of not shaking hands and practicing proper handwashing remained relatively stable, the perceived difficulty of maintaining a 1.5-m distance from others increased considerably from mid-April through mid-July 2020. Another study also found fairly high compliance with hygiene measures during the COVID-19 pandemic, along with limited compliance on social distancing measures (36). This finding might be explained by the assumed negative effect of social distancing on mental health and loneliness (37–39). It is understandable that persons find it (increasingly) hard to be apart from others, specifically from their loved ones. Other factors, such as more practical barriers (e.g., difficult to keep distance in small corridors in the supermarket) (40) and perceived social norms (41), might also play a role.
Trust in the information and the measures from authorities was relatively high and stable throughout the first wave of the COVID-19 crisis. Other studies from New Zealand (42) and South Korea (43) have shown increased trust in government during the spring of 2020 compared with earlier years, which the authors attributed to the decisive and rapid governmental crisis response. A study in the United Kingdom suggests that trust can also rapidly decline, which was observed after government announcements to relax lockdown measures and news of misconduct by a high government official (44). Of note, recent research has also shown a decrease in public trust in the government’s approach to the COVID-19 crisis in the Netherlands from the end of May through the beginning of October (45). Whether this decreased trust is explained by relaxations of measures or other events/processes needs further investigation.
In our study, the differences in perceptions, trust, and self-reported behavior between subgroups were rather small. Overall, the largest observed differences were based on age and health condition. Older persons perceived COVID-19 as more severe and had more concerns about their own health than did younger persons. At the same time, older persons perceived the probability of their getting infected with the virus to be lower. A similar result was found in an earlier study on COVID-19 risk perceptions, which showed increased perceived risk for death among elderly persons but lower perceived risk for infection (14). An explanation for the lower perceived risk is that older persons might have adopted more stringent social distancing measures than younger persons and therefore perceived their risk for infection as being smaller. In formal communications, maintaining strict social distancing was recommended for persons >70 years of age, and it was recommended that everyone avoid visiting elderly persons (46). Respondents with a chronic health condition also perceived their risk of becoming infected to be more probable and the infection to be more severe, and they were more concerned than those with no underlying health condition.
In line with risk-perception literature and previous research on behavior during disease outbreaks (6), we also found small differences on the basis of sex. Although the risk for severe COVID-19 illness is higher for men (4), women in our study indicated slightly higher risk perceptions and were more likely to adopt measures to protect themselves and their family. Despite the considerable differences in infection rates between the different regions in the Netherlands and the increased risk to healthcare workers (4) and in contrast to previous perception study findings (15,19), we found few differences between persons on the basis of region of residence and healthcare employment.
One study limitation is that the study sample is not perfectly representative of the population of the Netherlands at large; specifically, our study included few respondents <30 years of age. Another limitation is that our operationalization of the variable “underlying health condition” includes all self-reported chronic or long-term conditions (except for allergies). At the start of this study, little was known about the specific underlying health conditions associated with increased risk for COVID-19, and these underlying conditions have therefore not been separately added to the survey as answer categories. In addition, the behaviors reported in our study are self-reported and might be subject to social desirability bias.
Our findings emphasize the need to monitor public perceptions and public responses among different groups during crises because these perceptions can change considerably over time and can differ among persons. Such insights are needed to be able to respond to changes in public perceptions and public responses with timely and accurate risk and crisis communication. To maintain public compliance with protective measures during the COVID-19 crisis, we also need to understand why persons struggle with adhering to these measures and what they need to help them overcome these difficulties. Consulting and collaborating with communities to understand their difficulties and needs during this unprecedented crisis is pivotal. When differences between perceptions, responses, and needs in certain groups are large (e.g., between younger and older persons), targeting or tailoring information to specific groups is advisable. Such group-targeted information should be well-adapted to common views in a specific group and should reach the group through various accessible channels (e.g., social media or postal mail) or intermediaries (e.g., schoolteachers, general practitioners).
Ms. de Vries is a PhD candidate at the National Institute for Public Health and the Environment (RIVM) in the Netherlands. Her academic background is in sociology and global health, and her PhD study focuses on the analysis of public perceptions of health risks and media coverage during public health crises.
Acknowledgments
We thank all respondents for their participation in our study as well as Rosa Joosten for her contribution to Figure 1.
This research was funded by the National Institute for Public Health and the Environment (RIVM).
References
- Tan W, Zhao X, Ma X, Wang W, Niu P, Xu W, et al. A novel coronavirus genome identified in a cluster of pneumonia cases—Wuhan, China 2019− 2020. China CDC Weekly. 2020;2:61–2. DOIGoogle Scholar
- World Health Organization. WHO announces COVID-19 outbreak a pandemic [cited 2020 Apr 10]. http://www.euro.who.int/en/health-topics/health-emergencies/coronavirus-covid-19/news/news/2020/3/who-announces-covid-19-outbreak-a-pandemic
- World Health Organization. WHO coronavirus disease (COVID-19) dashboard [cited 2021 Jan 24]. https://covid19.who.int
- European Centre for Disease Prevention and Control. Coronavirus disease 2019 (COVID-19) pandemic: increased transmission in the EU/EEA and the UK—ninth update. Stockholm; The Centre; 2020. p. 1–50.
- Hale T, Petherik A, Phillips T, Webster S. Variation in government responses to COVID-19: version 2.0 [2020 Jun 05]. https://www.bsg.ox.ac.uk/sites/default/files/2020-03/BSG-WP-2020-031-v2.0.pdf
- Bish A, Michie S. Demographic and attitudinal determinants of protective behaviours during a pandemic: a review. Br J Health Psychol. 2010;15:797–824. DOIPubMedGoogle Scholar
- World Health Organization. Risk Communication and Community Engagement (RCCE) action plan guidance COVID-19 preparedness and response [cited 2021 Jan 13]. https://www.who.int/publications/i/item/risk-communication-and-community-engagement-(rcce)-action-plan-guidance
- Brug J, Aro AR, Richardus JH. Risk perceptions and behaviour: towards pandemic control of emerging infectious diseases. Int J Behav Med. 2009;16:3.
- Gilles I, Bangerter A, Clémence A, Green EG, Krings F, Staerklé C, et al. Trust in medical organizations predicts pandemic (H1N1) 2009 vaccination behavior and perceived efficacy of protection measures in the Swiss public. Eur J Epidemiol. 2011;26:203–10. DOIPubMedGoogle Scholar
- Betsch C, Böhm R, Chapman GB. Using behavioral insights to increase vaccination policy effectiveness. Policy Insights Behav Brain Sci. 2015;2:61–73. DOIGoogle Scholar
- Geldsetzer P. Knowledge and perceptions of COVID-19 among the general public in the United States and the United Kingdom: a cross-sectional online survey. Ann Intern Med. 2020;173:157–60. DOIPubMedGoogle Scholar
- Roy D, Tripathy S, Kar SK, Sharma N, Verma SK, Kaushal V. Study of knowledge, attitude, anxiety & perceived mental healthcare need in Indian population during COVID-19 pandemic. Asian J Psychiatr. 2020;51:
102083 . DOIPubMedGoogle Scholar - Plohl N, Musil B. Modeling compliance with COVID-19 prevention guidelines: the critical role of trust in science. Psychol Health Med. 2021;26:1–12. DOIPubMedGoogle Scholar
- Bruine de Bruin W. Age differences in COVID-19 risk perceptions and mental health: Evidence from a national US survey conducted in March 2020. J Gerontol B Psychol Sci Soc Sci. 2020; Epub ahead of print. DOIPubMedGoogle Scholar
- Peres D, Monteiro J, Almeida M, Ladeira R. Risk perception of COVID-19 among the Portuguese healthcare professionals and general population. J Hosp Infect. 2020;105:434–7. DOIPubMedGoogle Scholar
- Zhong B-L, Luo W, Li HM, Zhang QQ, Liu XG, Li WT, et al. Knowledge, attitudes, and practices towards COVID-19 among Chinese residents during the rapid rise period of the COVID-19 outbreak: a quick online cross-sectional survey. Int J Biol Sci. 2020;16:1745–52. DOIPubMedGoogle Scholar
- McFadden SM, Malik AA, Aguolu OG, Willebrand KS, Omer SB. Perceptions of the adult US population regarding the novel coronavirus outbreak. PLoS One. 2020;15:
e0231808 . DOIPubMedGoogle Scholar - Niepel C, Kranz D, Borgonovi F, Emslander V, Greiff S. The coronavirus (COVID-19) fatality risk perception of US adult residents in March and April 2020. Br J Health Psychol. 2020;25:883–8. DOIPubMedGoogle Scholar
- Czeisler MÉ, Tynan MA, Howard ME, Honeycutt S, Fulmer EB, Kidder DP, et al. Public attitudes, behaviors, and beliefs related to COVID-19, stay-at-home orders, nonessential business closures, and public health guidance—United States, New York City, and Los Angeles, May 5–12, 2020. MMWR Morb Mortal Wkly Rep. 2020;69:751–8. DOIPubMedGoogle Scholar
- Reintjes R, Das E, Klemm C, Richardus JH, Keßler V, Ahmad A. “Pandemic Public Health Paradox”: time series analysis of the 2009/10 influenza A/H1N1 epidemiology, media attention, risk perception and public reactions in 5 European countries. PLoS One. 2016;11:
e0151258 . DOIPubMedGoogle Scholar - van der Weerd W, Timmermans DR, Beaujean DJ, Oudhoff J, van Steenbergen JE. Monitoring the level of government trust, risk perception and intention of the general public to adopt protective measures during the influenza A (H1N1) pandemic in The Netherlands. BMC Public Health. 2011;11:575. DOIPubMedGoogle Scholar
- Bults M, Beaujean DJ, Richardus JH, Voeten HA. Perceptions and behavioral responses of the general public during the 2009 influenza A (H1N1) pandemic: a systematic review. Disaster Med Public Health Prep. 2015;9:207–19. DOIPubMedGoogle Scholar
- Bangerter A, Krings F, Mouton A, Gilles I, Green EG, Clémence A. Longitudinal investigation of public trust in institutions relative to the 2009 H1N1 pandemic in Switzerland. PLoS One. 2012;7:
e49806 . DOIPubMedGoogle Scholar - Mayor E, Eicher V, Bangerter A, Gilles I, Clémence A, Green EG. Dynamic social representations of the 2009 H1N1 pandemic: Shifting patterns of sense-making and blame. Public Underst Sci. 2013;22:1011–24. DOIPubMedGoogle Scholar
- Bults M, Beaujean DJ, de Zwart O, Kok G, van Empelen P, van Steenbergen JE, et al. Perceived risk, anxiety, and behavioural responses of the general public during the early phase of the Influenza A (H1N1) pandemic in the Netherlands: results of three consecutive online surveys. BMC Public Health. 2011;11:2. DOIPubMedGoogle Scholar
- World Health Organization (WHO). Coronavirus disease 2019 (COVID-19): situation report—39 [cited 2021 Jan 13]. https://www.who.int/docs/default-source/coronaviruse/situation-reports/20200228-sitrep-39-covid-19.pdf?sfvrsn=5bbf3e7d_4
- Reusken CB, Buiting A, Bleeker-Rovers C, Diederen B, Hooiveld M, Friesema I, et al. Rapid assessment of regional SARS-CoV-2 community transmission through a convenience sample of healthcare workers, the Netherlands, March 2020. Euro Surveill. 2020;25:
2000334 . DOIPubMedGoogle Scholar - Government of the Netherlands. Dutch measures against coronavirus [cited 2021 Jan 13]. https://www.government.nl/topics/coronavirus-covid-19/tackling-new-coronavirus-in-the-netherlands
- National Institute for Public Health and the Environment (RIVM). COVID-19 dataset [cited 2021 Jan 13]. https://data.rivm.nl/covid-19
- Brabers AEM, Reitsema-van Rooijen M, de Jong JD. Consumentenpanel Gezondheidszorg: Basisrapport met informatie over het panel (2015) [cited 2021 Jan 13]. https://www.nivel.nl/nl/publicatie/consumentenpanel-gezondheidszorg-basisrapport-met-informatie-over-het-panel-2015
- Brabers A, Meijer M, Hooiveld M, de Jong J. Monitor griepachtige klachten en uitbraak van het coronavirus: het perspectief van de burger [cited 2021 Jan 13]. https://www.nivel.nl/nl/publicatie/monitor-griepachtige-klachten-en-uitbraak-van-het-coronavirus-het-perspectief-van-de
- Schol LGC, Mollers M, Swaan CM, Beaujean DJMA, Wong A, Timen A. Knowledge, perceptions and media use of the Dutch general public and healthcare workers regarding Ebola, 2014. BMC Infect Dis. 2018;18:18. DOIPubMedGoogle Scholar
- Centraal Bureau voor de Statistiek (CBS). Standaard Onderwijsindeling 2006 [cited 2021 Jan 13]. https://www.cbs.nl/nl-nl/onze-diensten/methoden/classificaties/onderwijs-en-beroepen/standaard-onderwijsindeling--soi--/standaard-onderwijsindeling-2006
- Rosenstock IM. The health belief model and preventive health behavior. Health Educ Monogr. 1974;2:354–86. DOIGoogle Scholar
- National Institute for Public Health and the Environment (RIVM). Waarom wel of niet naleven van de gedragsregels? [cited 2020 Nov 27]. https://www.rivm.nl/gedragsonderzoek/maatregelen-welbevinden/verklaringen-gedrag
- Tong KK, Chen JH, Yu EW, Wu AMS. Adherence to COVID-19 precautionary measures: applying the health belief model and generalised social beliefs to a probability community sample. Appl Psychol Health Well-Being. 2020;12:1205–23. DOIPubMedGoogle Scholar
- Venkatesh A, Edirappuli S. Social distancing in covid-19: what are the mental health implications? BMJ. 2020;369:m1379. DOIPubMedGoogle Scholar
- Tyrrell CJ, Williams KN. The paradox of social distancing: Implications for older adults in the context of COVID-19. Psychol Trauma. 2020;12(S1):S214–6. DOIPubMedGoogle Scholar
- Abel T, McQueen D. The COVID-19 pandemic calls for spatial distancing and social closeness: not for social distancing! Int J Public Health. 2020;65:231. DOIPubMedGoogle Scholar
- Coroiu A, Moran C, Campbell T, Geller AC. Barriers and facilitators of adherence to social distancing recommendations during COVID-19 among a large international sample of adults. PLoS One. 2020;15:
e0239795 . DOIPubMedGoogle Scholar - Andrews JL, Foulkes L, Blakemore S-J. Peer influence in adolescence: public-health implications for COVID-19. Trends Cogn Sci. 2020;24:585–7. DOIPubMedGoogle Scholar
- Sibley CG, Greaves LM, Satherley N, Wilson MS, Overall NC, Lee CHJ, et al. Effects of the COVID-19 pandemic and nationwide lockdown on trust, attitudes toward government, and well-being. Am Psychol. 2020;75:618–30. DOIPubMedGoogle Scholar
- Kye B, Hwang S-J. Social trust in the midst of pandemic crisis: Implications from COVID-19 of South Korea. Res Soc Stratif Mobil. 2020;68:
100523 . DOIPubMedGoogle Scholar - Fancourt D, Steptoe A, Wright L. The Cummings effect: politics, trust, and behaviours during the COVID-19 pandemic. Lancet. 2020;396:464–5. DOIPubMedGoogle Scholar
- National Institute for Public Health and the Environment (RIVM). Communicatie en vertrouwen: vertrouwen in Nederlandse aanpak [cited 2020 Nov 27]. https://www.rivm.nl/gedragsonderzoek/maatregelen-welbevinden/communicatie-en-vertrouwen
- Government of the Netherlands. Coronavirus: what does it mean to ‘keep your distance’? [cited 2020 Jun 22]. https://www.government.nl/latest/news/2020/03/16/coronavirus-what-does-it-mean-to-%E2%80%98keep-your-distance%E2%80%99
Figures
Tables
Cite This ArticleOriginal Publication Date: January 25, 2021
1These authors contributed equally to this article.
Table of Contents – Volume 27, Number 4—April 2021
| EID Search Options |
|---|
|
|
|
|
|
|