Persistence of SARS-CoV-2 N-Antibody Response in Healthcare Workers, London, UK
Madhumita Shrotri

, Ross J. Harris, Alison Rodger, Timothy Planche, Frances Sanderson, Tabitha Mahungu, Alastair McGregor, Paul T. Heath, Colin S. Brown, Jake Dunning, Susan Hopkins, Shamez Ladhani, Meera Chand, and
The LondonCOVID Group
Author affiliations: Public Health England, London, UK (M. Shrotri, R.J. Harris, C.S. Brown, J. Dunning, S. Hopkins, S. Ladhani, M. Chand); University College London, London (A. Rodger); Royal Free NHS Foundation Trust, London (A. Rodger, T. Mahungu, C.S. Brown); St. George’s University Hospitals NHS Foundation Trust, London (T. Planche); St. George’s University of London (T. Planche, P.T. Heath, S. Ladhani); Imperial College Healthcare NHS Trust, London (F. Sanderson); London North West University Healthcare NHS Trust, London (A. McGregor)
Main Article
Figure
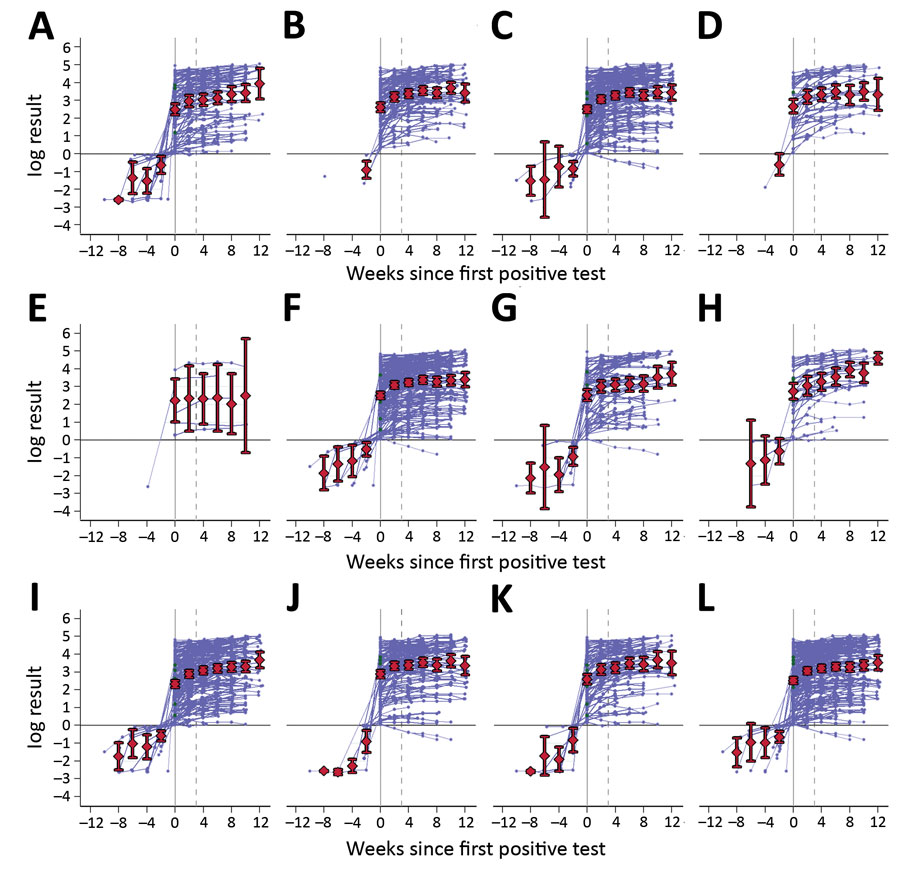
Figure. log antibody titers over time in participants with >1 positive test result by subgroups in study of nucleocapsid-antibody response in healthcare workers, London, UK. Subgroups are as follows: A) no self-reported illness (n = 99), B) coronavirus disease (COVID-19) diagnosis (n = 94), C) respiratory illness (n = 175), D) other illness (n = 43), E) immunocompromised (n = 6), F) general hospital employee (n = 204), G) emergency department employee (n = 71), H) intensive care unit employee (n = 38), I) age <40 years (n = 185), J) age >40 years (n = 127), K) male sex (n = 95), L) female sex (n = 217). Times are with respect to the date of the first positive test (week 0), and week 4 is indicated by dashed lines; previous negative results are also included. Individual responses are indicated by blue lines; mean titers with 95% CI for the mean are shown in red.
Main Article
Page created: February 09, 2021
Page updated: March 18, 2021
Page reviewed: March 18, 2021
The conclusions, findings, and opinions expressed by authors contributing to this journal do not necessarily reflect the official position of the U.S. Department of Health and Human Services, the Public Health Service, the Centers for Disease Control and Prevention, or the authors' affiliated institutions. Use of trade names is for identification only and does not imply endorsement by any of the groups named above.