Skip directly to site content Skip directly to page options Skip directly to A-Z link Skip directly to A-Z link Skip directly to A-Z link
Volume 27, Number 4—April 2021
Dispatch

SARS-CoV-2 Seropositivity among US Marine Recruits Attending Basic Training, United States, Spring–Fall 2020

Andrew G. LetiziaComments to Author , Yongchao Ge, Carl W. Goforth, Dawn L. Weir, Rhonda Lizewski, Stephen Lizewski, Alessandra Soares-Schanoski, Sindhu Vangeti, Nada Marjanovic, Stuart C. Sealfon, and Irene RamosComments to Author 
Author affiliations: Naval Medical Research Center, Silver Spring, Maryland, USA (A.G. Letizia, C.W. Goforth, D.L. Weir); Icahn School of Medicine at Mount Sinai, New York, New York, USA (Y. Ge, A. Soares-Schanoski, S. Vangeti, N. Marjanovic, S.C. Sealfon, I. Ramos); Naval Medical Research Unit 6, Lima, Peru (R. Lizewski, S. Lizewski)

Main Article

Figure 2

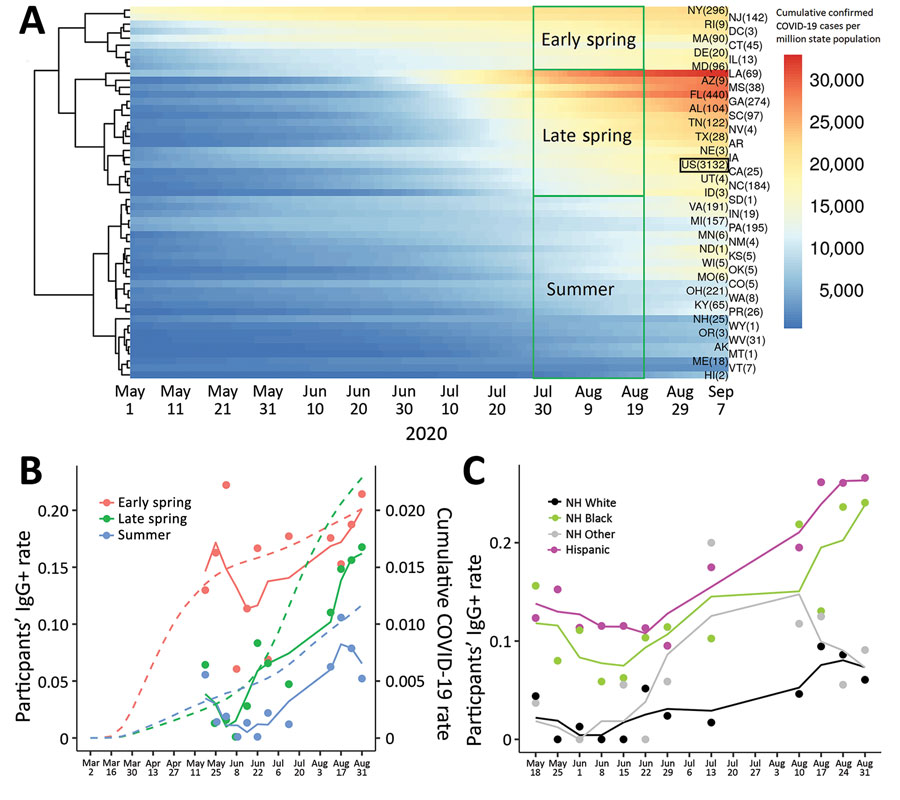
Confirmed COVID-19 and severe acute respiratory syndrome coronavirus 2 (SARS-CoV-2) IgG-positivity by state, race, and ethnicity, in a study of US Marine recruits, May 11–September 7, 2020. A) Heatmap of cumulated confirmed COVID-19 cases normalized by each state’s population. Each row represents 1 state, and number in parentheses indicates number of participants. Color reflects cumulative PCR-confirmed cases per 1 million state population (data obtained from COVID-19 Data Repository by the Center for Systems Science and Engineering at Johns Hopkins University, https://github.com/CSSEGISandData/COVID-19). Each column indicates 1 day during May 1–September 7, 2020. The US in aggregate is shown in the black box. B) SARS-CoV-2 IgG-seropositivity rate by week of enrollment on the basis of state groupings. Colored dots indicate the weekly IgG-positivity rate for study participants grouped by state; colored solid lines show 3-week running means. Dotted lines indicate cumulative PCR-confirmed COVID-19 cases in each state grouping obtained from COVID-19 Data Repository, including data before the study commenced. C) SARS-CoV-2 IgG-positivity by race and ethnicity. Colored dots indicate weekly IgG-positivity rate for study participants; colored solid lines indicate 3-week running means. Because of the relatively small number of participants in the first study week (May 11), they are merged into May 18 data. COVID-19, coronavirus disease; NH, Non-Hispanic.

Figure 2. Confirmed COVID-19 and severe acute respiratory syndrome coronavirus 2 (SARS-CoV-2) IgG-positivity by state, race, and ethnicity, in a study of US Marine recruits, May 11–September 7, 2020. A) Heatmap of cumulated confirmed COVID-19 cases normalized by each state’s population. Each row represents 1 state, and number in parentheses indicates number of participants. Color reflects cumulative PCR-confirmed cases per 1 million state population (data obtained from COVID-19 Data Repository by the Center for Systems Science and Engineering at Johns Hopkins University, https://github.com/CSSEGISandData/COVID-19). Each column indicates 1 day during May 1–September 7, 2020. The US in aggregate is shown in the black box. B) SARS-CoV-2 IgG-seropositivity rate by week of enrollment on the basis of state groupings. Colored dots indicate the weekly IgG-positivity rate for study participants grouped by state; colored solid lines show 3-week running means. Dotted lines indicate cumulative PCR-confirmed COVID-19 cases in each state grouping obtained from COVID-19 Data Repository, including data before the study commenced. C) SARS-CoV-2 IgG-positivity by race and ethnicity. Colored dots indicate weekly IgG-positivity rate for study participants; colored solid lines indicate 3-week running means. Because of the relatively small number of participants in the first study week (May 11), they are merged into May 18 data. COVID-19, coronavirus disease; NH, Non-Hispanic.

Main Article

Page created: January 26, 2021
Page updated: March 18, 2021
Page reviewed: March 18, 2021
The conclusions, findings, and opinions expressed by authors contributing to this journal do not necessarily reflect the official position of the U.S. Department of Health and Human Services, the Public Health Service, the Centers for Disease Control and Prevention, or the authors' affiliated institutions. Use of trade names is for identification only and does not imply endorsement by any of the groups named above.
file_external