Volume 28, Number 3—March 2022
Research
Nowcasting (Short-Term Forecasting) of COVID-19 Hospitalizations Using Syndromic Healthcare Data, Sweden, 2020
Armin Spreco , Anna Jöud, Olle Eriksson, Kristian Soltesz, Reidar Källström, Örjan Dahlström, Henrik Eriksson, Joakim Ekberg, Carl-Oscar Jonson, Carl-Johan Fraenkel, Torbjörn Lundh, Philip Gerlee, Fredrik Gustafsson, and Toomas Timpka
Figure 2
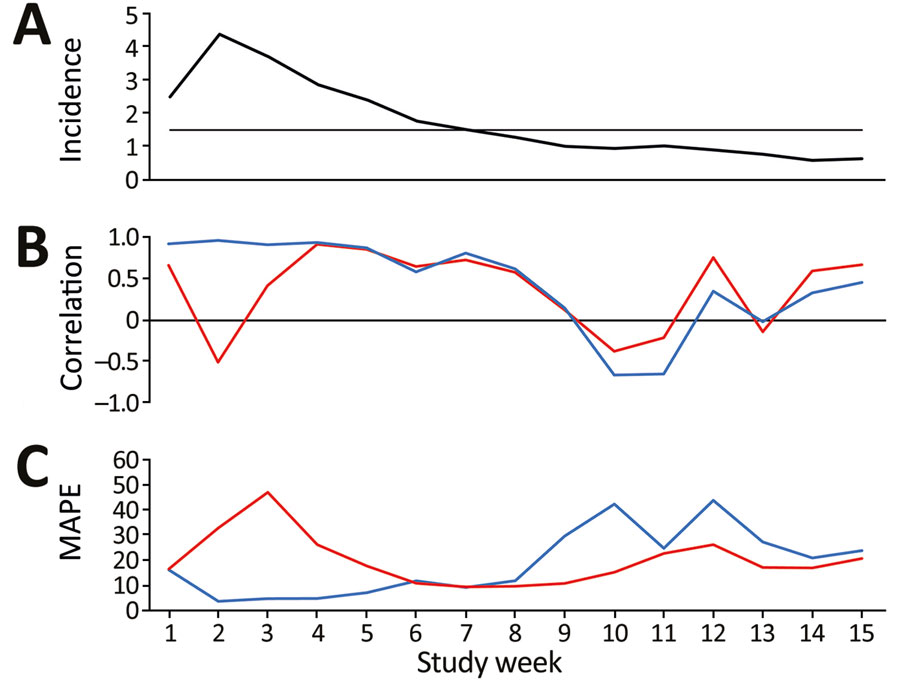
Figure 2. Local nowcasting performance in Östergötland County, Sweden, during the first wave of coronavirus disease (COVID-19), March 22–June 30, 2020. A) Weekly average of daily incidence of COVID-19, hospitalizations/week/100,000 population. The horizontal line indicates lowest incidence for reliable predictions (1.5 daily hospitalizations/100,000 population). B) Weekly average of daily correlation between telenursing data and COVID-19 hospitalizations from the nowcasting date through the period covered by the time lag for cough by adult (blue line) and fever by adult (red line). C) Weekly average of daily MAPE per week for cough by adult (blue line) and fever by adult (red line). MAPE, mean absolute percentage error.
Page created: January 11, 2022
Page updated: February 21, 2022
Page reviewed: February 21, 2022
The conclusions, findings, and opinions expressed by authors contributing to this journal do not necessarily reflect the official position of the U.S. Department of Health and Human Services, the Public Health Service, the Centers for Disease Control and Prevention, or the authors' affiliated institutions. Use of trade names is for identification only and does not imply endorsement by any of the groups named above.