Skip directly to site content Skip directly to page options Skip directly to A-Z link Skip directly to A-Z link Skip directly to A-Z link
Volume 28, Number 3—March 2022
Dispatch

Epidemiology of COVID-19 after Emergence of SARS-CoV-2 Gamma Variant, Brazilian Amazon, 2020–2021

Vanessa C. Nicolete, Priscila T. Rodrigues, Anderson R.J. Fernandes, Rodrigo M. Corder, Juliana Tonini, Lewis F. Buss, Flávia C. Sales, Nuno R. Faria, Ester C. Sabino, Marcia C. Castro, and Marcelo U. FerreiraComments to Author 
Author affiliations: University of São Paulo, São Paulo, Brazil (V.C. Nicolete, P.T. Rodrigues, A.R.J. Fernandes, R.M. Corder, J. Tonini, L.F. Buss, F.C. Sales, N.R. Faria, E.C. Sabino, M.U. Ferreira); Imperial College London, London, UK (N.R. Faria); University of Oxford, Oxford, UK (N.R. Faria); Harvard T.H. Chan School of Public Health, Boston, Massachusetts, USA (M.C. Castro)

Main Article

Figure 2

Severe acute respiratory syndrome coronavirus 2 (SARS-CoV-2) infection and clinically apparent coronavirus disease (COVID-19) during the first and second epidemic waves, Brazilian Amazon, 2020–2021. A) Monthly cases (bars) and COVID-19–associated deaths (dashed line) notified in the municipality of Mâncio Lima, Brazil, during April 2020–April 2021. Light blue shading represents serosurveys conducted during October–November 2020; light peach shading represents serosurveys conducted during April–May 2021; arrows indicate dates of SARS-CoV-2 isolate collection for genomic surveillance. B) Distribution of study participants (n = 1,215) according to SARS-CoV-2 IgG detected in each serosurvey. The 288 for whom IgG seroconverted during April–May 2021 includes 79 vaccinated persons (light blue), who were not considered when estimating rates of seroconversion resulting from natural SARS-CoV-2 infection. C) Age-specific percentages of persons positive for SARS-CoV-2 IgG at the end of the first wave (October–November 2020; light blue dots) and of IgG seroconversions among initially seronegative persons by the second wave (April–May 2021; light peach dots). Error bars indicate 95% CIs. D) Age-specific percentages of SARS-CoV-2 infections that led to clinically apparent COVID-19 during the first wave (light blue dots) and second wave (light peach dots). Denominators correspond to the number of participants with serologic evidence of SARS-CoV-2 infection during the period. Error bars indicate 95% CIs.

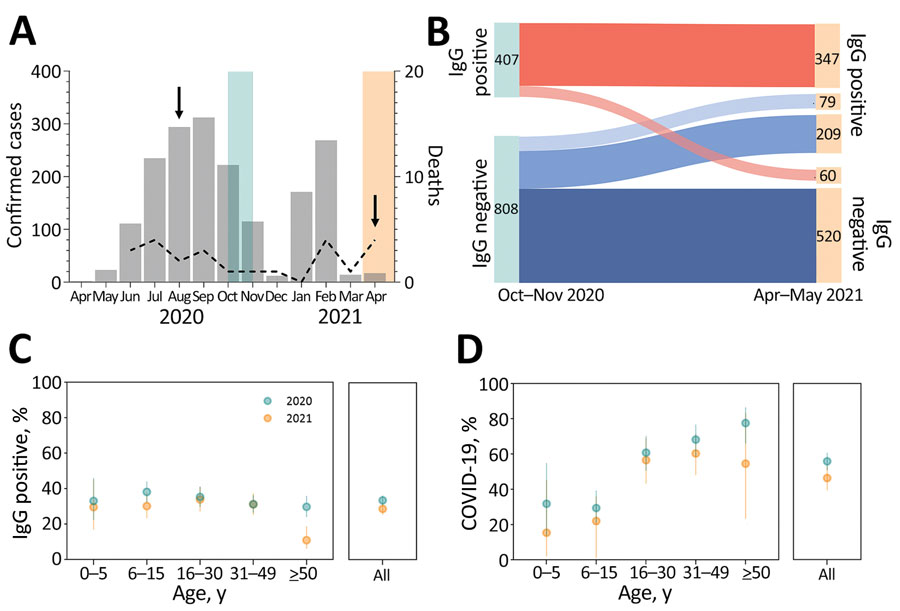
Figure 2. Severe acute respiratory syndrome coronavirus 2 (SARS-CoV-2) infection and clinically apparent coronavirus disease (COVID-19) during the first and second epidemic waves, Brazilian Amazon, 2020–2021. A) Monthly cases (bars) and COVID-19–associated deaths (dashed line) notified in the municipality of Mâncio Lima, Brazil, during April 2020–April 2021. Light blue shading represents serosurveys conducted during October–November 2020; light peach shading represents serosurveys conducted during April–May 2021; arrows indicate dates of SARS-CoV-2 isolate collection for genomic surveillance. B) Distribution of study participants (n = 1,215) according to SARS-CoV-2 IgG detected in each serosurvey. The 288 for whom IgG seroconverted during April–May 2021 includes 79 vaccinated persons (light blue), who were not considered when estimating rates of seroconversion resulting from natural SARS-CoV-2 infection. C) Age-specific percentages of persons positive for SARS-CoV-2 IgG at the end of the first wave (October–November 2020; light blue dots) and of IgG seroconversions among initially seronegative persons by the second wave (April–May 2021; light peach dots). Error bars indicate 95% CIs. D) Age-specific percentages of SARS-CoV-2 infections that led to clinically apparent COVID-19 during the first wave (light blue dots) and second wave (light peach dots). Denominators correspond to the number of participants with serologic evidence of SARS-CoV-2 infection during the period. Error bars indicate 95% CIs.

Main Article

Page created: December 20, 2021
Page updated: February 21, 2022
Page reviewed: February 21, 2022
The conclusions, findings, and opinions expressed by authors contributing to this journal do not necessarily reflect the official position of the U.S. Department of Health and Human Services, the Public Health Service, the Centers for Disease Control and Prevention, or the authors' affiliated institutions. Use of trade names is for identification only and does not imply endorsement by any of the groups named above.
file_external