Volume 29, Number 10—October 2023
Research
Effects of COVID-19 on Maternal and Neonatal Outcomes and Access to Antenatal and Postnatal Care, Malawi
Leonard Mndala , Chikondi Chapuma, Jennifer Riches, Luis Gadama, Fannie Kachale, Rosemary Bilesi, Malangizo Mbewe, Andrew Likaka, Moses Kumwenda, Regina Makuluni, Bertha Maseko, Chifundo Ndamala, Annie Kuyere, Laura Munthali, Deborah Phiri, Edward J.M. Monk, Marc Y.R. Henrion, Maria L. Odland1, and David Lissauer1
Figure 4
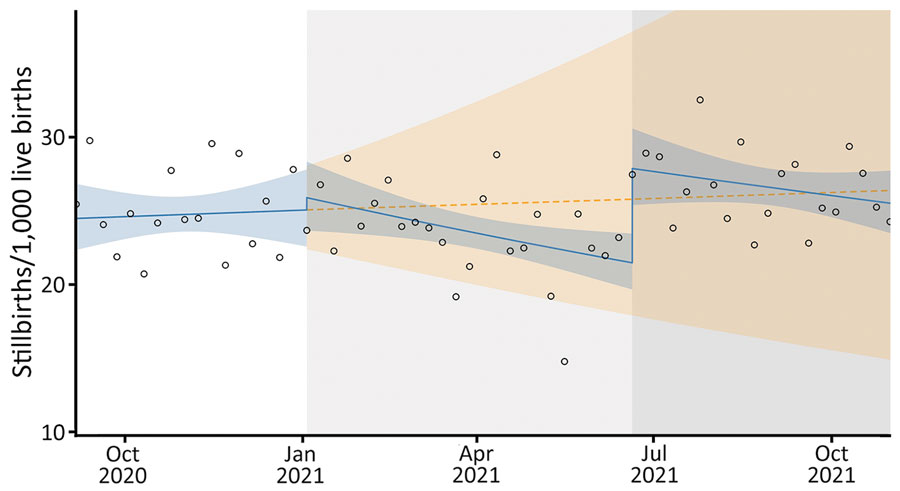
Figure 4. Stillbirth rates in study of effects of COVID-19 on maternal and neonatal outcomes and access to antenatal and postnatal care, Malawi. Circles indicate observed data; blue lines indicate model fit from actual data, including step and slope changes during second (January 1, 2021) and third (June 20, 2021) COVID-19 waves. Dashed orange line indicates the counterfactual scenario of no second or third COVID−19 waves. Blue shaded areas indicate 95% CIs; yellow shaded areas indicate 95% CIs for the counterfactual scenario. Background shaded areas indicate the second (light gray) and third (dark gray) COVID−19 waves in Malawi. Pseudo−R2 = 0.04.
1These authors contributed equally to this article.
Page created: August 18, 2023
Page updated: September 20, 2023
Page reviewed: September 20, 2023
The conclusions, findings, and opinions expressed by authors contributing to this journal do not necessarily reflect the official position of the U.S. Department of Health and Human Services, the Public Health Service, the Centers for Disease Control and Prevention, or the authors' affiliated institutions. Use of trade names is for identification only and does not imply endorsement by any of the groups named above.