Emergence of SARS-CoV-2 Delta Variant and Effect of Nonpharmaceutical Interventions, British Columbia, Canada
Y.L. Elaine Chan

, Michael A. Irvine, Natalie Prystajecky, Hind Sbihi, Marsha Taylor, Yayuk Joffres, Andrea Schertzer, Caren Rose, Louise Dyson, Edward M. Hill, Michael Tildesley, John R. Tyson, Linda M.N. Hoang, and Eleni Galanis
Author affiliations: British Columbia Centre for Disease Control, Vancouver, British Columbia, Canada (Y.L.E. Chan, M.A. Irvine, N. Prystajecky, H. Sbihi, M. Taylor, Y. Joffres, A. Schertzer, C. Rose, J.R. Tyson, L.M.N. Hoang, E. Galanis); Public Health Agency of Canada, Ottawa, Ontario, Canada (Y.L.E. Chan, A. Schertzer); Simon Fraser University, Burnaby, British Columbia, Canada (M.A. Irvine); University of British Columbia, Vancouver (N. Prystajecky, H. Sbihi, C. Rose, L.M.N. Hoang, E. Galanis); University of Warwick, Coventry, UK (L. Dyson, E.M. Hill, M. Tildesley); Joint UNIversities Pandemic and Epidemiological Research (L. Dyson, E.M. Hill, M. Tildesley)
Main Article
Figure 3
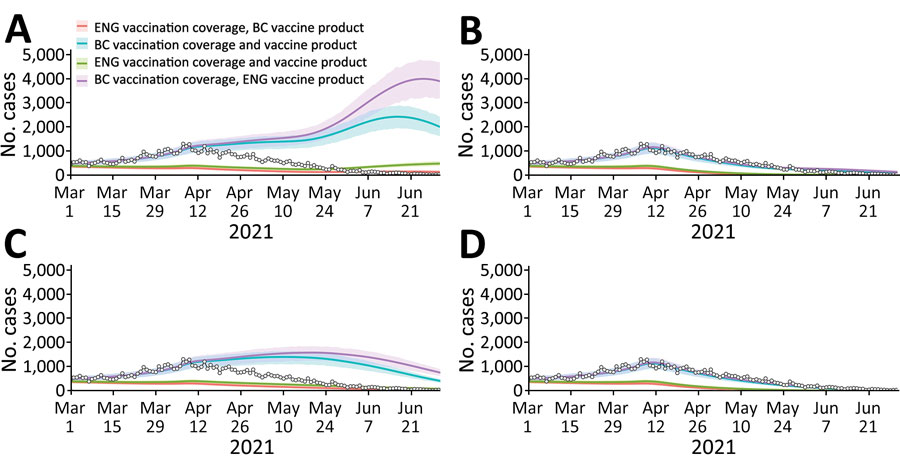
Figure 3. Retrospective counterfactual modeling of COVID-19 transmission in BC, Canada, March 1–June 30, 2021, compared with information from England. Model fitting for March 1, 2020, to July 12, 2021. A) England public health measures and proportion of Delta; B) BC public health measures and England proportion of Delta; C) England public health measures and BC proportion of Delta; D) BC public health measures and proportion of Delta. Each panel represents transmission scenarios derived from 1,000 variational Bayes samples, where measures that affect transmission and the proportion of Delta are reflective of BC or England. Each median line and 90% projection interval shading within each panel represents the vaccination scenario (i.e., population vaccine coverage and majority vaccine product of BC or England). The reported COVID-19 cases for BC are overlaid on each figure as white circles. BC, British Columbia.
Main Article
Page created: August 07, 2023
Page updated: September 20, 2023
Page reviewed: September 20, 2023
The conclusions, findings, and opinions expressed by authors contributing to this journal do not necessarily reflect the official position of the U.S. Department of Health and Human Services, the Public Health Service, the Centers for Disease Control and Prevention, or the authors' affiliated institutions. Use of trade names is for identification only and does not imply endorsement by any of the groups named above.