Serotype Distribution and Disease Severity in Adults Hospitalized with Streptococcus pneumoniae Infection, Bristol and Bath, UK, 2006‒2022
Catherine Hyams
1
, Robert Challen
1, David Hettle, Zahin Amin-Chowdhury, Charli Grimes, Gabriella Ruffino, Rauri Conway, Robyn Heath, Paul North, Adam Malin, Nick A. Maskell, Philip Williams, O. Martin Williams, Shamez N. Ladhani, Leon Danon, and Adam Finn
Author affiliations: University of Bristol, Bristol, UK (C. Hyams, R. Challen, R. Heath, L. Danon, A. Finn); Southmead Hospital, Bristol (C. Hyams, C. Grimes, G. Ruffino, R. Conway, N.A. Maskell, A. Finn); Bristol Royal Infirmary, Bristol (D. Hettle, P. North, P. Williams, O.M. Williams); UK Health Security Agency, London, UK (Z. Amin-Chowdhury, S.N. Ladhani); The Royal United Hospital, Bath, UK (A. Malin)
Main Article
Figure 2
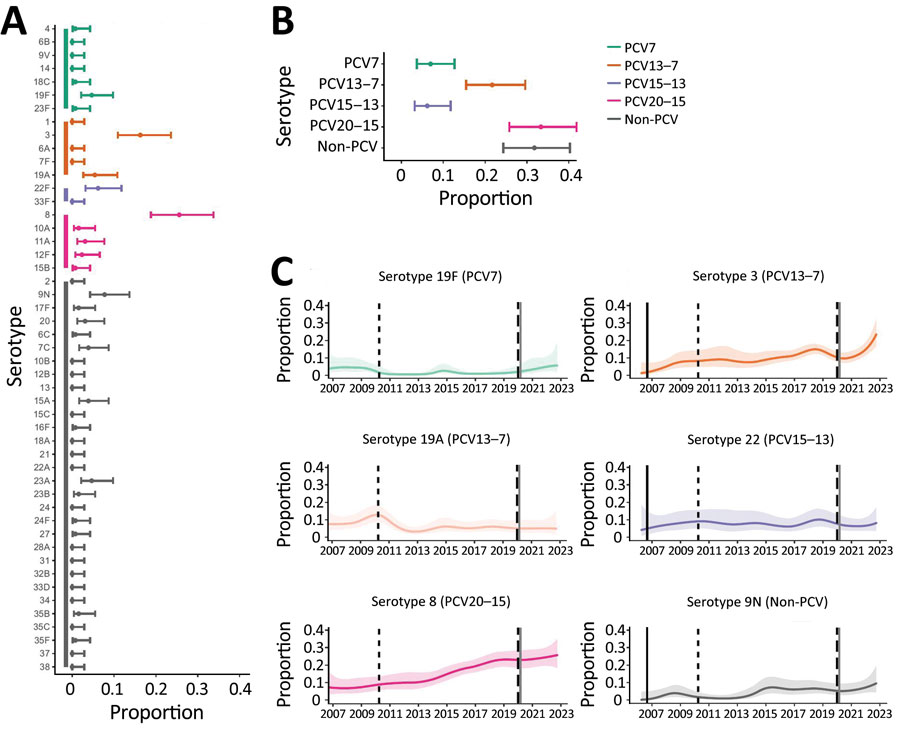
Figure 2. Distribution of pneumococcal serotypes in hospitalized patients after emergence of SARS-CoV-2. A, B) Proportion of pneumococcal disease attributable to each serotype (A) and PCV vaccine group (B) from 129 case-patients in Bristol, UK, hospitalized during January 1, 2021‒December 31, 2022. C) Binomial (one versus others) time series models showing the percentage of disease during January 2006‒December 2022 attributable to each of the 6 most common pneumococcal serotypes. Solid lines indicate smoothed point estimates; error bars/shaded areas indicate 95% CIs. The 95% CIs in panels A and B do not coincide exactly with those in panel C because they represent different length time periods and use different models. Additional data and time points are available in Table 2. PCV, pneumococcal conjugate vaccine.
Main Article
Page created: July 31, 2023
Page updated: September 15, 2023
Page reviewed: September 15, 2023
The conclusions, findings, and opinions expressed by authors contributing to this journal do not necessarily reflect the official position of the U.S. Department of Health and Human Services, the Public Health Service, the Centers for Disease Control and Prevention, or the authors' affiliated institutions. Use of trade names is for identification only and does not imply endorsement by any of the groups named above.