Volume 29, Number 2—February 2023
Research
Correlates of Protection, Thresholds of Protection, and Immunobridging among Persons with SARS-CoV-2 Infection
Abstract
Several studies have shown that neutralizing antibody levels correlate with immune protection from COVID-19 and have estimated the relationship between neutralizing antibodies and protection. However, results of these studies vary in terms of estimates of the level of neutralizing antibodies required for protection. By normalizing antibody titers, we found that study results converge on a consistent relationship between antibody levels and protection from COVID-19. This finding can be useful for planning future vaccine use, determining population immunity, and reducing the global effects of the COVID-19 pandemic
Determining the relationship between immune response and protection from symptomatic SARS-CoV-2 infection (i.e., COVID-19) is useful for predicting the future effectiveness of vaccines. That relationship should enable immunobridging (i.e., predicting the efficacy of candidate vaccines) that can help with approval of new or updated vaccines based on immunogenicity data, without the need for large phase 3 trials (1). Immunobridging is used for approval of seasonal influenza vaccines in the European Union and the United States and reduces the costs and time required to develop vaccines. In addition, defining levels of immunity required for protection from novel SARS-CoV-2 variants will be useful for predicting population-level immunity to infection and guiding public health policy on vaccination and boosting.
Figure 1
![Predicting protection from symptomatic SARS-CoV-2 infection by using approaches to elucidate the relationship between neutralizing antibody titers and protection from COVID-19 (the protection curve): the vaccine-comparison (A–C) and breakthrough-infection (D–F) approaches. The 2 approaches are illustrated schematically: data used (A, D); model fit to data (B, E); and estimated protection (C, F) The vaccine-comparison approach used data on mean neutralization titer from phase 1/2 vaccine trials (normalized to convalescing persons in the same study; x-axis) and observed vaccine efficacy against symptomatic SARS-CoV-2 infection in phase 3 trials (y-axis; n = 7 vaccine trials plus 1 study of infection risk in convalescing persons) (A, B). Using the observed distribution in neutralization titers for a given vaccine and the protection curve, we sum over the whole population to predict the proportion of susceptible (red) or protected (blue) persons for a given vaccine and to estimate protective efficacy for different neutralizing antibody levels (C). Fitting across all vaccines and convalescent persons simultaneously derives the protection curve that best fits the neutralization and protection data (B). The breakthrough-infection model uses neutralization titers of persons with symptomatic breakthrough infections (n = 36 for mRNA-1273 [Moderna, https://www.modernatx.com] and n = 47 for ChAdOx1 [AstraZeneca, https://www.astrazeneca.com]) and uninfected persons (n = 1,005 for mRNA-1273 and n = 828 for ChAdOx1) (3,4). This method’s underlying risk model adjusts for demographic risk factors and for the probability of being sampled in the study to remove these potential sources of bias (E). The protection curve reflects an estimate of the vaccine efficacy in subgroups of persons with specific neutralization titers after the 2-phase sampling design was adjusted for (F). Data and model relationship in panels A and B are from (2).](/eid/images/22-1422-F1-tn.jpg)
Figure 1. Predicting protection from symptomatic SARS-CoV-2 infection by using approaches to elucidate the relationship between neutralizing antibody titers and protection from COVID-19 (the protection curve): the vaccine-comparison (A–C) and breakthrough-infection (D–F)...
Several studies have shown that higher levels of neutralizing antibody are associated with immune protection from symptomatic SARS-CoV-2 infection during short-term follow-up after vaccination (2–6). Three of those studies also tried to estimate the level of protection associated with particular antibody levels by using 2 approaches to estimate the relationship between neutralizing antibody levels and vaccine efficacy (2–4) (protection curve; Table; Figure 1). Although those studies reported threshold antibody levels required for 50% or 70% protection, all found that protection changes gradually with neutralization titer and, thus, there is not a strict threshold below which persons are not protected or above which protection is achieved.
The study of immune correlates by Khoury et al. used a vaccine-comparison approach, which estimated the relationship between mean neutralizing antibody levels (in phase 1/2 trials) and vaccine efficacy (in phase 3 trials) across 7 vaccines and convalescing persons (after first normalizing neutralization titers to convalescing persons in each study) (2) (Table; Figure 1, panels A–C). That study estimated that the neutralizing antibody level associated with 50% protection from COVID-19 was ≈20% of the mean titer for persons in the convalescent phase (or 54 IU/mL) (2). More recently, 2 studies compared neutralizing antibody titers from persons vaccinated with mRNA 1273 (Moderna, https://www.modernatx.com) or ChAdOx1 (AstraZeneca, https://www.astrazeneca.com) with or without symptomatic breakthrough infection (Figure 1, panels D–F). Those studies reported 70% protective thresholds ranging from 4 to 33 IU/mL (Table), depending on the assay used, suggesting a potential role of assay differences in the discrepancies (Appendix) (3,4). The apparent discrepancies between studies pose a challenge to the use of protection curves in guiding public health decisions. Therefore, we studied whether those results can be reconciled by accounting for the different methods used. This work was approved under the University of New South Wales Sydney Human Research Ethics Committee (approval HC200242). All data and codes are available from GitHub (https://github.com/InfectionAnalytics/ReconcilingCorrelatesOfProtection).
A major limitation for reconciling thresholds of protection (Table) is lack of a standardized assay for measuring in vitro neutralization titers. Although an international standard has been established (7), reported titers seem affected by the assay used, as would be expected from differences in cells, virus, and outcomes measured (8). For example, even when neutralization titers are measure against the same stocks of pooled convalescent-phase plasma (e.g., the World Health Organization [WHO] 20/130 standard), different assays produced geometric mean neutralization titers (GMT) that varied from 120 to >12,000 (7). Even after standardizing measurements from different assays into international units (Table), standardized neutralization titers across the assays still differed by up to 50-fold (7). This difference in neutralization titers across different assays is also evident when comparing the 3 studies quantifying the threshold of protection (Table) (2–4). For example, Gilbert et al. reported the GMT for mRNA-1273 as ≈247 IU/mL (4), compared with 1,057 IU/mL reported by Khoury et al. (2) (Appendix). A quick survey of the literature reveals 6 reported estimates of the GMT for mRNA-1273 vaccinees, ranging from 247 IU/mL (95% CI 231–264) to 1,404 (95% CI 795–2,484) IU/mL, depending on the study (Appendix Table 1). Similarly, estimates of the GMT for ChAdOx1 vaccinees ranged from 23 IU/mL (3) to 144 IU/mL (2). When the same neutralization assay is run across different laboratories, then international standards are probably a very effective mechanism for adjusting for interlaboratory variability. However, it is clear from those discrepancies that expression of titers in international units is insufficient for normalizing between different assays and comparing the thresholds of protection reported in these studies (Appendix), which most likely results from differences in the assays themselves (8).
An alternative approach for normalizing neutralization titers between studies is to assume that similar groups of vaccinees should have similar titers. For example, rather than relying on conversion to the WHO international units, we can assume that the mean neutralization for the mRNA-1273 vaccinees is similar in the phase 1/2 trials (as analyzed by Khoury et al. [2,10]) and in the phase 3 trial (as analyzed by Gilbert et al. [4,11]) (Appendix). Normalization is limited because it does not account for differences in baseline characteristics of the cohort vaccinated in each study (e.g., age), which may influence neutralization titers. However, because immunobridging studies also rely on comparing vaccine titers among different groups, this approach is pragmatic for overcoming the limitations of comparing different assays.
Figure 2
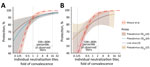
Figure 2. Comparisons of the estimated curves for protection from SARS-CoV-2 infection from 2 vaccines: A) mRNA-1273 (Moderna, https://www.modernatx.com) (4); B) ChAdOx1 (AstraZeneca, https://www.astrazeneca.com) (3...
Applying this normalization approach enabled us to compare the protection curves across different immune correlate studies (Appendix). We aligned the data by assuming that the mean titer for mRNA-1273- or ChAdOx1-vaccinated persons is the same between the phase 1/2 trials and the phase 3 trials for each vaccine (Figure 2; Appendix). Although this normalization is independent of the x-axis scale used, we plotted both curves onto a fold-of-convalescent level scale (Table) developed by Khoury et al. (2) for illustration. This transformation enabled a more direct comparison of the protection curve across the 3 studies. Considering the mRNA-1273 breakthrough-infection model (4) (Figure 2, panel A), for example, we saw good agreement with the Khoury et al. model (2) at the higher neutralization levels achieved with mRNA-1273 vaccination (albeit a seemingly slightly lower maximum protection level predicted in the breakthrough-infection model) but very poor agreement at low neutralization levels. This finding is easily understandable considering the distribution of individual neutralization titers in the mRNA-1273 breakthrough-infection study, in which only ≈10% of participants had a neutralization titer less than the mean titer of early convalescent-phase participants (Figure 2, panel A). Thus, neutralization data with which to estimate protection at lower neutralization levels are sparse (hence, the wide confidence intervals in this region of the curve). Similarly, the ChAdOx1 protection curve (Figure 2, panel B) shows good agreement with the Khoury et al. analysis (2) in the region in which neutralization data are available in the breakthrough-infection study (Figure 2, panel B).
The broad CIs and divergence of the models for which neutralization data are sparse suggests the need for caution when extrapolating the relationship between neutralization and protection beyond the ranges of data available in each study. The vaccine comparison approach has the advantage of fitting to a large span of neutralization titers (a 20-fold range in GMT between the 7 vaccines) (2), enabling prediction of the vaccine efficacy over a wide range of neutralization titers. Because none of the reported phase 3 studies of ancestral SARS-CoV-2 infection reported efficacy <50% or >95%, the vaccine-comparison analysis also extrapolates efficacy above and below these levels. However, studies of vaccine efficacy and effectiveness against SARS-CoV-2 variants suggests that the curve remains predictive against the Alpha, Beta, Delta, and Omicron variants, for which lower neutralization titers are observed (12; D. Khoury et al., unpub. data, https://www.medrxiv.org/content/10.1101/2021.12.13.21267748v2).
Figure 3
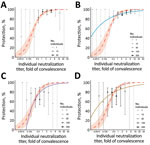
Figure 3. Breakthrough-infection data and protection from SARS-CoV-2 infection showing the association between neutralizing antibody titer and protection from symptomatic SARS-CoV-2 infection for an individual person. A) BNT162b2 (Pfizer-BioNTech, https://www.pfizer.com)...
The analysis above does not allow direct visualization or comparison of the fit of the data from breakthrough infection to the data from the vaccine-comparison study. We developed a method for estimating unadjusted protection at different neutralization levels from the breakthrough-infection data (Appendix), which also enables inclusion of data from a third breakthrough-infection study of BNT162b2 (Pfizer-BioNTech, https://www.pfizer.com) vaccinees (5). We show data from the 3 breakthrough-infection studies compared with the vaccine-comparison approach (normalized for the mean vaccinee titer in each study) (Figure 3). Data from the breakthrough-infection studies show remarkable agreement with the vaccine-comparison model (within the neutralization ranges for which sufficient data were available for each breakthrough-infection study), despite the fundamentally different data, assays, and approaches used to estimate protection curves in each study. Furthermore, after alignment to the GMT of each vaccine group, we can use the underlying distribution in neutralizing antibody titers along with the protection curves from each of these studies to predict the overall vaccine efficacy for existing vaccines (as has been done for the Khoury et al. model [2)]) (Appendix Methods). That approach reveals good agreement between all models and the observed data, at least in the ranges where data were available to parameterize the models (Appendix Figure 1). This approach provides cross-validation of the protection curves but also provides a lesson that all models should be used cautiously outside the ranges of the data over which they were developed.
Immunobridging to Predict Vaccine Efficacy
For vaccine development, an immune correlate to predict the efficacy of a novel vaccine without the need for large and expensive phase 3 efficacy trials would greatly accelerate the approval of novel vaccines (13). Similarly, for incorporating novel SARS-CoV-2 variant immunogens, being able to use surrogate measures to predict vaccine efficacy would be helpful. On a public health level, information about neutralization of new variants as they arise and predicting likely population immunity to them would help with predicting future infection risk. In addition, predicting changes in vaccine efficacy with immunity waning and in cohorts with lower neutralization titers after vaccination (e.g., in elderly or immunocompromised persons) could provide information about the need for boosting and other immune protective strategies (12).
If a standardized neutralization assay were widely used, it would, in principle, be possible to offer a globally applicable GMT neutralization titer (threshold) associated with a given level of protection, which regulators and vaccine developers could use as a target when assessing and approving vaccines (e.g., as the hemagglutination inhibition titer provides for influenza infection). However, the lack of assay standardization means that no such threshold in international units can be determined that is broadly applicable across different neutralizing antibody assays. Alternatively, regulators have signaled that immunobridging studies, which compare the immunogenicity of new vaccines with that of existing vaccines (for which efficacy has previously been determined) should be conducted (14,15). That is, vaccine developers need to identify a suitable existing vaccine for comparison and determine the noninferiority or superiority margins relative to these vaccines in a randomized controlled trial (i.e., how much higher neutralization titers are required to be or how much lower titers are permitted to be compared with existing vaccines). The protection curves reported so far (2–4) can be used to define the parameters of these noninferiority or superiority trials. For example, using the vaccine-comparison model derived by Khoury et al. (2) (Figure 1, panel C), we can estimate the noninferiority or superiority margins to existing vaccines that would provide >80% efficacy against ancestral virus (Appendix Table 2, Figure 2). If mRNA-1273 or BNT162b2 are used as comparator vaccines, finding a noninferiority margin of 0.44-fold of the GMT observed in mRNA-1273 vaccinees or 0.54-fold of the GMT observed in BNT162b2 vaccinees would provide high confidence that the candidate vaccine has >80% efficacy (against ancestral virus). Using ChAdOx1 (with 4-week spacing of doses) as a comparator, we found that a superiority margin of 2.6-fold of GMT compared with ChAdOx1 vaccinees would provide similarly high confidence of >80% vaccine efficacy. Of note, those margins are in strong agreement with the lower 95% CIs predicted in the breakthrough-infection studies (Figure 2), which would predict that a candidate vaccine that induced 0.44-fold of the GMT for mRNA-1273 vaccinees would be expected to have an efficacy of >85% (either of the 2 neutralization assays reported in that study, on the basis of the reported lower 95% CI) and that a margin of 2.6-fold of the mean ChAdOx1 titer would predict an efficacy of >76% (the lower 95% CI of Feng et al. models do not reach 80% in all cases (Figure 2; Appendix) (3,4). The consensus of these 3 studies provides strong support for using noninferiority or superiority margins in future immunobridging studies.
Identifying Protective Thresholds for Individual Persons
A second goal for the study of protective thresholds is to identify a protective titer for clinical use, that is, a simple blood test for clinically relevant antibody level to indicate if a person is likely to have good protection from COVID-19. The studies that have defined the relationship between neutralization titer and vaccine efficacy have not been designed for, and are not primarily concerned with, defining such a threshold because they deal only with estimates of vaccine efficacy at a population level. Furthermore, individual predictions from population statistics can be fraught with difficulty. Unfortunately, the term “threshold” gives the impression that there might be an antibody level above which one is fully protected (and below which one is susceptible). However, the shapes of the protection curves (Figure 2) make it clear that there is a gradient of risk at different neutralization titers. Moreover, the between-run variability of assays is typically large enough that the uncertainty in the neutralization titer estimated for an individual serum sample is sufficient to lead to wide confidence intervals for the predicted protection for that person (Appendix). For example, when typical duplicate-well and 2-fold serum dilution neutralizing assay designs are used (16,17), a person with a neutralizing antibody titer at exactly the level associated with 50% protection would have 95% CIs on the estimated protection, ranging from 15% to 85% protection (Appendix), although that range will depend on the precision of a particular assay. It is worth noting that these are estimates of protection from symptomatic SARS-CoV-2 infection (the primary outcome of the studies analyzed), and protection against severe outcomes is achieved at lower neutralization titers (2). Together, the wide CIs when estimating individual neutralization titers and the standardization between different serologic assays are major limitations for ability to accurately assess individual neutralizing antibody titers and predict individual protection.
Predicting vaccine efficacy or a clinically useful threshold of protection against COVID-19 would be a major advance. The in vitro neutralization titer has been demonstrated by multiple studies to be well correlated with vaccine efficacy and with a person’s protection from symptomatic SARS-CoV-2 infection (2–6,12; D.H. Khoury et al., unpub. data). The 4 studies that found significant relationships between neutralization titers and vaccine efficacy used different methods (2–5), and data from different clinical trials with neutralization data assessed across a range of neutralization assays. Those factors may all contribute to apparent discrepancies between the relationships reported in each study. However, we show that after centering the data from each study on the GMT of the vaccine used in each study, the 4 studies converge on a common prediction of the relationship between neutralization and protection against infection (within the bounds of data available within each study). The agreement of these studies strongly supports the use of neutralizing antibody titers to predict the efficacy of new vaccines or vaccine efficacy against new variants (assuming the fold drop in neutralization titer for the variant can be estimated). Although neutralizing antibody levels are a clear correlate of protection, identifying a protective threshold applicable to a serologic test is more challenging, in part because no such threshold exists, but instead, there is a gradient of vaccine efficacy that increases with neutralization. Furthermore, significant challenges to defining a particular threshold at which a person’s neutralization titer might be deemed to provide high protection from COVID-19 include the diversity of assays used to measure neutralization, the difficulty in translating neutralization levels between assays, the constant emergence of new and more escaped variants, and the uncertainties of estimating individual neutralization titers.
An additional major challenge is adapting assays (and protection curves) to deal with neutralization of current and future SARS-CoV-2 variants. The studies discussed in this analysis primarily deal with neutralization of and protection from the ancestral SARS-CoV-2 strain because the breakthrough-infection data and vaccine efficacy data in most studies was from phase 3 clinical trials (2–4), which studied infection within the first few months after vaccination and which were mainly conducted before variants of concern had a major foothold, except for the Bergwerk et al. study (5), which was conducted during in the Alpha-dominant period. It would be ideal to be able to adapt each model of immune correlates to test its ability to predict protection against variants of concern. However, until recently, only the vaccine-comparison model has been extended to analyze protection against SARS-CoV-2 variants (12,18,19; D. Cromer et al., unpub. data, https://www.medrxiv.org/content/10.1101/2022.06.09.22275942v1), although a recent study has begun to explore this question by using a breakthrough-infection approach (20). The work on the vaccine-comparison model approach has so far shown that this model, which was originally calibrated on data for ancestral SARS-CoV-2 infections, can also be used to predict vaccine effectiveness against SARS-CoV-2 variants and after boosting, as long as one adjusts for the drop in neutralization titers to the variants and rise in neutralization after boosting (12,18,19; D. Cromer et al., unpub. data). However, the need to standardize neutralization assays for SARS-CoV-2 variants presents an ongoing challenge.
In vitro neutralizing antibody titers against SARS-CoV-2 present a clear correlate of protection from symptomatic SARS-CoV-2 infection. Studies of passive administration of neutralizing monoclonal antibodies in animals and humans support that neutralizing antibody titers are a mechanistic correlate of protection (21–23). Indeed, a recent study comparing protective titers in prophylactic and therapeutic studies suggests that the protective titers may be very similar (E. Stadler et al., unpub. data, https://www.medrxiv.org/content/10.1101/2022.03.21.22272672v2). Neutralizing antibody levels are also correlated with protection from severe SARS-CoV-2 infection (2).
In conclusion, our findings show that the different COVID-19 correlate of protection studies, which seemingly report different thresholds of protection, have strong agreement. However, other immune responses may also play a substantial role in protection against progression from symptomatic to severe SARS-CoV-2 infection. The agreement across multiple studies of the relationship between neutralizing antibodies and efficacy against COVID-19 can be useful for planning future vaccine use, determining population immunity, and reducing the global effects of the COVID-19 pandemic.
Dr. Khoury is an interdisciplinary researcher and group leader at the Kirby Institute, University of New South Wales. He originally trained in applied mathematics and has conducted research on infectious disease drug treatment and immunity since 2012, with a focus on malaria, HIV, and COVID-19.
Acknowledgments
We thank Moriah Bergwerk, Tal Gonen, Gili Regev-Yoshay, and colleagues for supplying the raw data from their study of neutralization titers in BNT162b2-vaccinated healthcare workers (5).
This work is supported by Australian government Medical Research Future Fund awards GNT2002073 (M.P.D. and S.J.K.), MRF2005544 (S.J.K. and M.P.D.), MRF2005760 (M.P.D.), and MRF2007221 (J.A.T. and M.S.); a National Health and Medical Research Council (NHMRC) program grant GNT1149990 (S.J.K. and M.P.D.); and the Victorian Government (S.J.K.). D.S.K. and S.J.K. are supported by NHMRC fellowships. D.C. and M.P.D. are supported by NHMRC Investigator grants. The Melbourne WHO Collaborating Centre for Reference and Research on Influenza is supported by the Australian Government Department of Health.
The funding sources had no role in the writing of the manuscript or the decision to submit it for publication or in data collection, analysis, or interpretation or in any aspect pertinent to the study. Authors were not precluded from accessing data in the study, and they accept responsibility to submit for publication
D.S.K., D.C., M.S., K.S., S.J.K., J.A.T., and M.P.D. contributed to the conceptual development and data collection. D.S.K., T.E.S., D.C., Y.F., P.B.G., and M.P.D. contributed to the methods, formal analysis, and visualization. All authors contributed to the writing and reviewed and approved the final report. All authors had full access to all the data in the study and had final responsibility for the decision to submit for publication.
References
- Huddleston J, Barnes JR, Rowe T, Xu X, Kondor R, Wentworth DE, et al. Integrating genotypes and phenotypes improves long-term forecasts of seasonal influenza A/H3N2 evolution. eLife. 2020;9:
e60067 . DOIPubMedGoogle Scholar - Khoury DS, Cromer D, Reynaldi A, Schlub TE, Wheatley AK, Juno JA, et al. Neutralizing antibody levels are highly predictive of immune protection from symptomatic SARS-CoV-2 infection. Nat Med. 2021;27:1205–11. DOIPubMedGoogle Scholar
- Feng S, Phillips DJ, White T, Sayal H, Aley PK, Bibi S, et al.; Oxford COVID Vaccine Trial Group. Correlates of protection against symptomatic and asymptomatic SARS-CoV-2 infection. Nat Med. 2021;27:2032–40. DOIPubMedGoogle Scholar
- Gilbert PB, Montefiori DC, McDermott AB, Fong Y, Benkeser D, Deng W, et al.; Immune Assays Team§; Moderna, Inc. Team§; Coronavirus Vaccine Prevention Network (CoVPN)/Coronavirus Efficacy (COVE) Team§; United States Government (USG)/CoVPN Biostatistics Team§. Immune correlates analysis of the mRNA-1273 COVID-19 vaccine efficacy clinical trial. Science. 2022;375:43–50. DOIPubMedGoogle Scholar
- Bergwerk M, Gonen T, Lustig Y, Amit S, Lipsitch M, Cohen C, et al. Covid-19 breakthrough infections in vaccinated health care workers. N Engl J Med. 2021;385:1474–84. DOIPubMedGoogle Scholar
- Earle KA, Ambrosino DM, Fiore-Gartland A, Goldblatt D, Gilbert PB, Siber GR, et al. Evidence for antibody as a protective correlate for COVID-19 vaccines. Vaccine. 2021;39:4423–8. DOIPubMedGoogle Scholar
- World Health Organization. Establishment of the WHO International Standard and Reference Panel for anti-SARS-CoV-2 antibody. Geneva: Expert Committee on Biological Standardization; 2020. p. 9–10.
- Khoury DS, Wheatley AK, Ramuta MD, Reynaldi A, Cromer D, Subbarao K, et al. Measuring immunity to SARS-CoV-2 infection: comparing assays and animal models. Nat Rev Immunol. 2020;20:727–38. DOIPubMedGoogle Scholar
- Folegatti PM, Ewer KJ, Aley PK, Angus B, Becker S, Belij-Rammerstorfer S, et al.; Oxford COVID Vaccine Trial Group. Safety and immunogenicity of the ChAdOx1 nCoV-19 vaccine against SARS-CoV-2: a preliminary report of a phase 1/2, single-blind, randomised controlled trial. Lancet. 2020;396:467–78. DOIPubMedGoogle Scholar
- Jackson LA, Anderson EJ, Rouphael NG, Roberts PC, Makhene M, Coler RN, et al.; mRNA-1273 Study Group. mRNA-1273 Study Group. An mRNA vaccine against SARS-CoV-2—preliminary report. N Engl J Med. 2020;383:1920–31. DOIPubMedGoogle Scholar
- Baden LR, El Sahly HM, Essink B, Kotloff K, Frey S, Novak R, et al.; COVE Study Group. Efficacy and safety of the mRNA-1273 SARS-CoV-2 vaccine. N Engl J Med. 2021;384:403–16. DOIPubMedGoogle Scholar
- Cromer D, Steain M, Reynaldi A, Schlub TE, Wheatley AK, Juno JA, et al. Neutralising antibody titres as predictors of protection against SARS-CoV-2 variants and the impact of boosting: a meta-analysis. Lancet Microbe. 2022;3:e52–61. DOIPubMedGoogle Scholar
- Walter EB, Talaat KR, Sabharwal C, Gurtman A, Lockhart S, Paulsen GC, et al.; C4591007 Clinical Trial Group. C4591007 Clinical Trial Group. Evaluation of the BNT162b2 Covid-19 vaccine in children 5 to 11 years of age. N Engl J Med. 2022;386:35–46. DOIPubMedGoogle Scholar
- Medicines & Healthcare Products Regulatory Agency; Access Consortium. alignment with ICMRA consensus on immunobridging for authorising new COVID-19 vaccines [cited 2022 Apr 8]. https://www.gov.uk/government/publications/access-consortium-alignment-with-icmra-consensus-on-immunobridging-for-authorising-new-covid-19-vaccines/access-consortium-alignment-with-icmra-consensus-on-immunobridging-for-authorising-new-covid-19-vaccines
- Medicines & Healthcare Products Regulatory Agency. Guidance on strain changes in authorised COVID-19 vaccines [cited 2022 Apr 8]. https://www.gov.uk/government/publications/access-consortium-guidance-on-strain-changes-in-authorised-covid-19-vaccines/guidance-on-strain-changes-in-authorised-covid-19-vaccines
- Juno JA, Tan HX, Lee WS, Reynaldi A, Kelly HG, Wragg K, et al. Humoral and circulating follicular helper T cell responses in recovered patients with COVID-19. Nat Med. 2020;26:1428–34. DOIPubMedGoogle Scholar
- Wheatley AK, Juno JA, Wang JJ, Selva KJ, Reynaldi A, Tan HX, et al. Evolution of immune responses to SARS-CoV-2 in mild-moderate COVID-19. Nat Commun. 2021;12:1162. DOIPubMedGoogle Scholar
- Cele S, Jackson L, Khoury DS, Khan K, Moyo-Gwete T, Tegally H, et al.; NGS-SA; COMMIT-KZN Team. Omicron extensively but incompletely escapes Pfizer BNT162b2 neutralization. Nature. 2022;602:654–6. DOIPubMedGoogle Scholar
- Cromer D, Reynaldi A, Steain M, Triccas JA, Davenport MP, Khoury DS. Relating in vitro neutralisation level and protection in the CVnCoV (CUREVAC) trial. Clin Infect Dis. 2022;75:e878–9. DOIPubMedGoogle Scholar
- Fong Y, McDermott AB, Benkeser D, Roels S, Stieh DJ, Vandebosch A, et al.; Immune Assays Team; the Coronavirus Vaccine Prevention Network (CoVPN)/ENSEMBLE Team; and the United States Government (USG)/CoVPN Biostatistics Team. Immune correlates analysis of the ENSEMBLE single Ad26.COV2.S dose vaccine efficacy clinical trial. Nat Microbiol. 2022;7:1996–2010. DOIPubMedGoogle Scholar
- Plotkin SA. Vaccines: correlates of vaccine-induced immunity. Clin Infect Dis. 2008;47:401–9. DOIPubMedGoogle Scholar
- O’Brien MP, Forleo-Neto E, Musser BJ, Isa F, Chan KC, Sarkar N, et al.; Covid-19 Phase 3 Prevention Trial Team. Subcutaneous REGEN-COV Antibody Combination to Prevent Covid-19. N Engl J Med. 2021;385:1184–95. DOIPubMedGoogle Scholar
- Cohen MS, Nirula A, Mulligan MJ, Novak RM, Marovich M, Yen C, et al.; BLAZE-2 Investigators. BLAZE-2 Investigators. Effect of bamlanivimab vs placebo on incidence of COVID-19 among residents and staff of skilled nursing and assisted living facilities: a randomized clinical trial. JAMA. 2021;326:46–55. DOIPubMedGoogle Scholar
Figures
Table
Cite This ArticleOriginal Publication Date: January 16, 2023
Table of Contents – Volume 29, Number 2—February 2023
| EID Search Options |
|---|
|
|
|
|
|
|
Please use the form below to submit correspondence to the authors or contact them at the following address:
Addresses for correspondence: David Khoury and Miles Davenport, L6 Wallace Wurth Building, Kirby Institute, UNSW Sydney, Kensington, NSW 2052, Australia
Top