Similar Prevalence of Plasmodium falciparum and Non–P. falciparum Malaria Infections among Schoolchildren, Tanzania1
Rachel Sendor
2, Cedar L. Mitchell
2, Frank Chacky, Ally Mohamed, Lwidiko E. Mhamilawa, Fabrizio Molteni, Ssanyu Nyinondi, Bilali Kabula, Humphrey Mkali, Erik J. Reaves, Naomi Serbantez, Chonge Kitojo, Twilumba Makene, Thwai Kyaw, Meredith Muller, Alexis Mwanza, Erin L. Eckert, Jonathan B. Parr, Jessica T. Lin
3, Jonathan J. Juliano
3
, and Billy Ngasala
3
Author affiliations: University of North Carolina, Chapel Hill, North Carolina, USA (R. Sendor, C.L. Mitchell, T. Kyaw, M. Muller, A. Mwanza, J.B. Parr, J.T. Lin, J.J. Juliano); National Malaria Control Programme, Dodoma, Tanzania (F. Chacky, A. Mohamed); Muhimbili University of Health and Allied Sciences, Dar es Salaam, Tanzania (L.E. Mhamilawa, T. Makene, B. Ngasala); Swiss Tropical and Public Health Institute, Basel, Switzerland (F. Molteni); RTI International, Dar es Salaam (S. Nyinondi, B. Kabula, H. Mkali); US Centers for Disease Control and Prevention, Dar es Salaam (E.J. Reaves); US Agency for International Development, Dar es Salaam (N. Serbantez, C. Kitojo); RTI International, Washington, DC, USA (E.L. Eckert); Uppsala University, Uppsala, Sweden (B. Ngasala)
Main Article
Figure 5
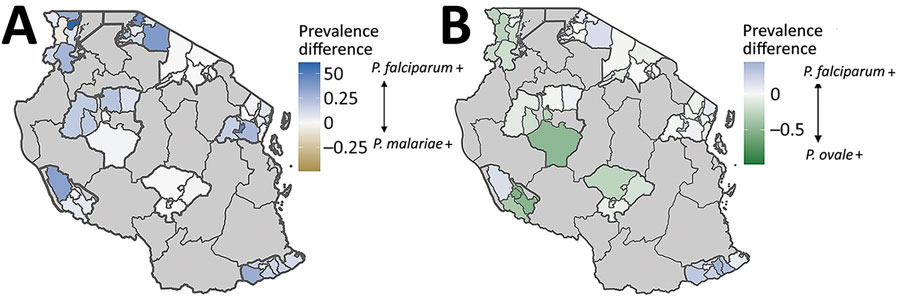
Figure 5. Differential scaled prevalences between Plasmodium malariae or P. ovale and P. falciparum at the school council level in study of similar prevalence of Plasmodium falciparum and non–P. falciparum malaria infections among schoolchildren, Tanzania. A) Blue shading indicates councils where P. falciparum scaled prevalence is greater (indicated by + in key) than P. malariae scaled prevalence; gold indicates regions where P. malariae scaled prevalence is greater. B) Light blue shading indicates councils where P. falciparum scaled prevalence is greater than P. ovale spp. scaled prevalence; green indicates regions where P. ovale scaled prevalence is greater. Comparison of scaled prevalences for P. falciparum and P. vivax is not depicted because the low number of P. vivax infections biased the scaled measurement.
Main Article
Page created: March 13, 2023
Page updated: May 17, 2023
Page reviewed: May 17, 2023
The conclusions, findings, and opinions expressed by authors contributing to this journal do not necessarily reflect the official position of the U.S. Department of Health and Human Services, the Public Health Service, the Centers for Disease Control and Prevention, or the authors' affiliated institutions. Use of trade names is for identification only and does not imply endorsement by any of the groups named above.