Skip directly to site content Skip directly to page options Skip directly to A-Z link Skip directly to A-Z link Skip directly to A-Z link
Volume 30, Number 1—January 2024
Dispatch

Respiratory Viruses in Wastewater Compared with Clinical Samples, Leuven, Belgium

Annabel Rector, Mandy Bloemen, Marijn Thijssen, Bram Pussig, Kurt Beuselinck, Marc Van Ranst, and Elke WollantsComments to Author 
Author affiliations: KU Leuven Rega Institute, Louvain, Belgium (A. Rector, M. Bloemen, M. Thijssen, M. Van Ranst, E. Wollants); KU Leuven Academic Center for General Practice, Louvain (B. Pussig); University Hospitals Leuven, Louvain (K. Beuselinck, M. Van Ranst).

Main Article

Figure 2

Respiratory viruses measured in wastewater versus number of positive clinical samples, Leuven, Belgium, January 2021–December 2022: A) HBoV; B) EV/RV and EV-D68; C) HPeV; D) SARS-CoV-1; SARS-CoV-2; and MERS-CoV; E) HCoV-NL63; F) HCoV-229E; G) HCoV-OC43; H) HCoV-HKU-1. Graphs indicate evolution of viruses detected in wastewater by an in-house–developed multiplex quantitative PCR respiratory panel (line graphs; dots represent individual measurements) and by weekly counts of PCR-positive tests detected at UZL (bar graphs). Plots were generated using R version 4.1.1 (The R Foundation for Statistical Computing, https://www.r-project.org) and the ggplot2 package version 3.3.5 (https://ggplot2.tidyverse.org). A larger version of this figure is available at https://wwwnc.cdc.gov/EID/article/30/1/23-1011-F2.htm. Ct, cycle threshold; EV, enterovirus; HBoV, bocavirus; HCoV, human coronavirus; HPeV, parechovirus; MERS-CoV, Middle East respiratory syndrome coronavirus; RV, rhinovirus; UZL, University Hospitals Leuven.

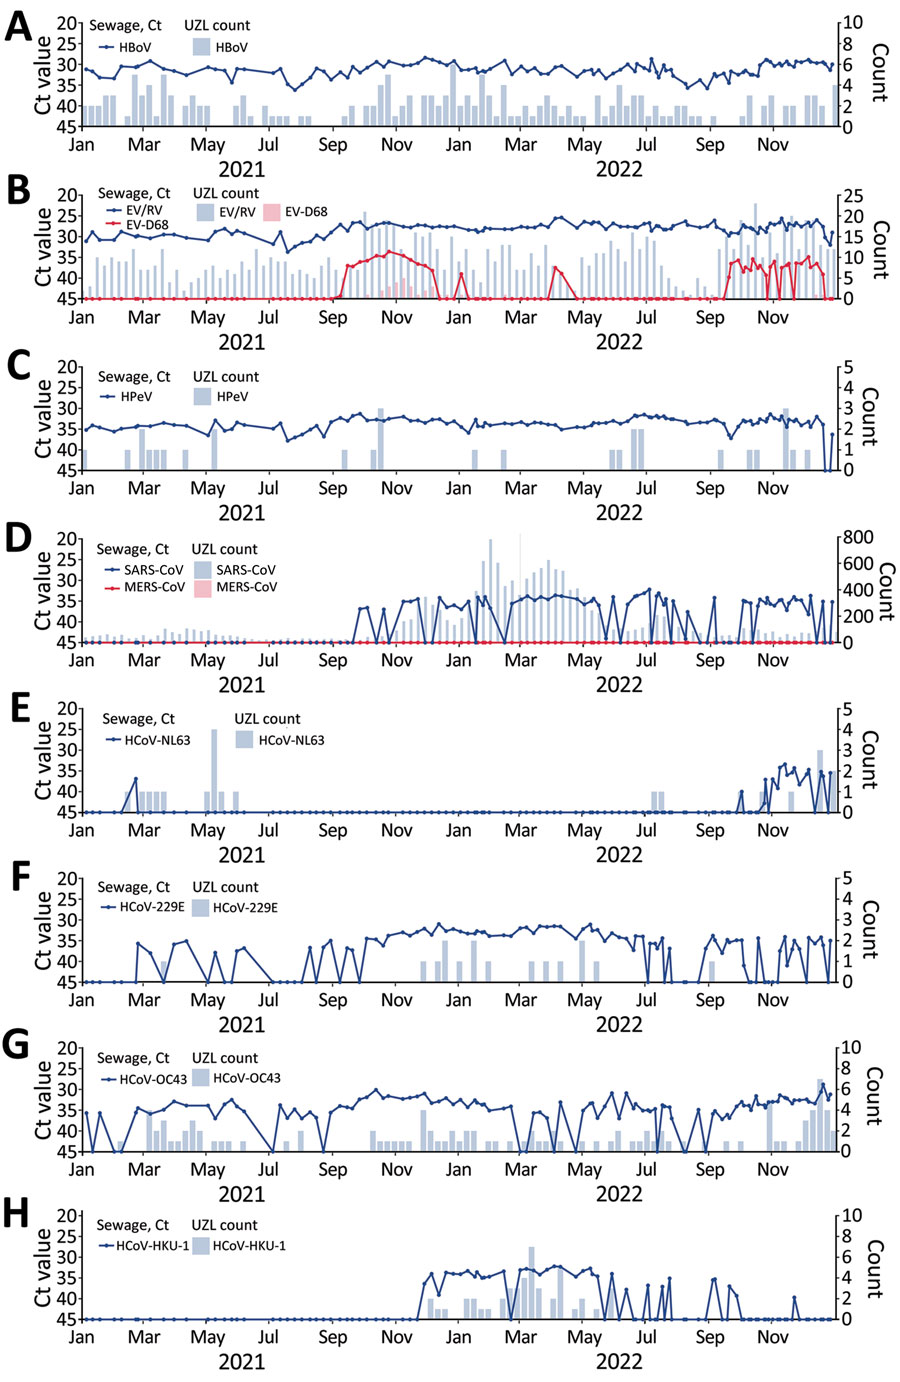
Figure 2. Respiratory viruses measured in wastewater versus number of positive clinical samples, Leuven, Belgium, January 2021–December 2022: A) HBoV; B) EV/RV and EV-D68; C) HPeV; D) SARS-CoV-1; SARS-CoV-2; and MERS-CoV; E) HCoV-NL63; F) HCoV-229E; G) HCoV-OC43; H) HCoV-HKU-1. Graphs indicate evolution of viruses detected in wastewater by an in-house–developed multiplex quantitative PCR respiratory panel (line graphs; dots represent individual measurements) and by weekly counts of PCR-positive tests detected at UZL (bar graphs). Plots were generated using R version 4.1.1 (The R Foundation for Statistical Computing, https://www.r-project.org) and the ggplot2 package version 3.3.5 (https://ggplot2.tidyverse.org). A larger version of this figure is available at https://wwwnc.cdc.gov/EID/article/30/1/23-1011-F2.htm. Ct, cycle threshold; EV, enterovirus; HBoV, bocavirus; HCoV, human coronavirus; HPeV, parechovirus; MERS-CoV, Middle East respiratory syndrome coronavirus; RV, rhinovirus; UZL, University Hospitals Leuven.

Main Article

Page created: November 07, 2023
Page updated: December 20, 2023
Page reviewed: December 20, 2023
The conclusions, findings, and opinions expressed by authors contributing to this journal do not necessarily reflect the official position of the U.S. Department of Health and Human Services, the Public Health Service, the Centers for Disease Control and Prevention, or the authors' affiliated institutions. Use of trade names is for identification only and does not imply endorsement by any of the groups named above.
file_external