Volume 30, Number 5—May 2024
Research
SARS-CoV-2 Transmission in Alberta, British Columbia, and Ontario, Canada, January 2020–January 2022
Abstract
We estimated COVID-19 transmission potential and case burden by variant type in Alberta, British Columbia, and Ontario, Canada, during January 23, 2020–January 27, 2022; we also estimated the effectiveness of public health interventions to reduce transmission. We estimated time-varying reproduction number (Rt) over 7-day sliding windows and nonoverlapping time-windows determined by timing of policy changes. We calculated incidence rate ratios (IRRs) for each variant and compared rates to determine differences in burden among provinces. Rt corresponding with emergence of the Delta variant increased in all 3 provinces; British Columbia had the largest increase, 43.85% (95% credible interval [CrI] 40.71%–46.84%). Across the study period, IRR was highest for Omicron (8.74 [95% CrI 8.71–8.77]) and burden highest in Alberta (IRR 1.80 [95% CrI 1.79–1.81]). Initiating public health interventions was associated with lower Rt and relaxing restrictions and emergence of new variants associated with increases in Rt.
Emergence of SARS-CoV-2 in 2019 resulted in the COVID-19 pandemic (1). Since then, the virus has mutated into multiple variants. Each variant differed in transmissibility and severity of health outcomes, leading to differences in incident case and death counts in different regions (2,3). COVID-19 transmission rates vary depending on multiple factors, including public health policies and characteristics of emerging variants. Interventions such as working from home, school closures, face mask mandates, and vaccination were implemented as efforts to control the pandemic.
Various studies have evaluated the effectiveness of pandemic interventions in Canada (4–7). Indoor mask mandates were found to be associated with weekly decreases of 22% in case counts (4). Physical distancing was found to effectively mitigate COVID-19 spread in Ontario (5). The mitigating effect of stay-at-home policies on COVID-19 spread in Toronto was also reported (7). Most of the previous studies conducted on populations in Canada have evaluated COVID-19 preventive measures in a single city or province or evaluated only 1 or 2 preventive measures. Limited research has been conducted comparing the additive mitigating effects of prevention and control measures among major provinces in Canada. With the exception of a few studies focused mainly on COVID-19 vaccine effectiveness, little research has examined the effects of initiating public health interventions or the emergence of new variants on COVID-19 transmission potential and disease burden in Canada (8,9). Moreover, differences in time-varying reproduction number (Rt) and incidence rate ratio (IRR) associated with specific SARS-CoV-2 variants have yet to be explored among populations in Canada. A 2020 study calculated IRR to compare disease burden across 3 provinces (10); however, variant-specific comparisons have yet to be explored.
We addressed 2 of those research questions in this study. First, we investigated transmission potential and case burden associated with wild-type, Alpha, Delta, and Omicron SARS-CoV-2 variants in Alberta, British Columbia, and Ontario. Second, we investigated the effectiveness of public health interventions to reduce SARS-CoV-2 transmission potential in those 3 provinces. The Georgia Southern University institutional review board determined that this project (H20364) did not involve human subjects under the G8 exemption category of Code of Federal Regulations Title 45, Part 46.
Data Acquisition
We downloaded and analyzed publicly available COVID-19 case data from Ontario, British Columbia, and Alberta. Data from Ontario, which is divided into 6 subprovincial public health regional areas—Central, East, North-East, North-West, Toronto, and West—came from 1,033,294 cases reported during January 23, 2020–January 27, 2022 (Appendix Table 1) (11,12). Data from British Columbia, which is divided into 5 subprovincial regional health authorities—Fraser, Interior, Northern, Vancouver Coastal, and Vancouver Island—came from 320,540 cases reported during January 29, 2020–January 27, 2022 (Appendix Table 2) (13,14). Data from Alberta, which is divided into 5 subprovincial health services zones—Calgary, Central, Edmonton, North, and South—came from 487,045 cases during March 6, 2020–January 27, 2022 (Appendix Table 3) (15,16).
We obtained information from the government of Canada, the Canadian Institute for Health Information, and the Upper Canada District School Board websites on COVID-19 policies, including descriptions and dates of implementation and relaxation (Appendix Table 4) (17–19). In addition to the policy timepoints, we recorded dates of incidence spikes because of Delta and Omicron variants, chosen to represent the beginning of the time period when emergence of the variant resulted in increases in case counts and Rt (Appendix Table 4). Through this analysis, we aimed to examine the effect on Rt of mitigation policies and emergence of highly transmissible variants. We used the Government of Canada website (20) as the source for data on COVID-19 variants, including weekly percentages for each identified variant among all cases for which samples were sequenced. Percentages represented the weekly distribution of confirmed cases by variant. We multiplied daily case counts by weekly variant percentages to estimate daily cases attributed to each variant (Appendix).
Statistical Analysis
We presented epidemic curves of weekly incident case count by province according to age group, sex, and public health district and log10-transformed monthly cumulative case counts in maps at the subprovincial level. Basic reproduction number (R0) is the average number of secondary cases of an infectious disease infected by the primary case-patient in a totally susceptible population (21). Rt, which is the expected number of new cases attributed to 1 infected person, changes over time because of public health interventions and the changing proportion of the population with immunity against the infection. An Rt >1 indicates epidemic growth, whereas Rt <1 indicates epidemic decline (22).
We used the R package EpiEstim (The R Project for Statistical Computing, https://cran.r-project.org/web/packages/EpiEstim/index.html) to estimate Rt from incident COVID-19 case counts in Ontario, British Columbia, and Alberta. Rt is estimated by calculating the ratio between the number of incident cases at time t and the total infectiousness of all infected persons at that same time (23,24). We specified a mean serial interval (SI) distribution of 4.60 d (SD 5.55 d) for the analysis (25). We generated 2 forms of Rt: a 7-day sliding-window Rt and a policy change Rt over nonoverlapping time-windows. The 7-day sliding-window Rt estimate is an average of daily Rt estimates over a sliding-window time period comprising the current day and the 6 immediately previous days; therefore, each daily Rt estimate is included in 7 different estimates. The policy change Rt is an average of daily Rt estimates over a nonoverlapping time-window in which each daily Rt is included in only 1 estimate. We conducted a sensitivity analysis of provincial-level Rt estimates that incorporated uncertainty associated with underreporting of infections. We calculated Rt using estimated infection counts assuming averages from one sensitivity analysis using a multiplier of 4 (26) and another using a multiplier of 11 (27) infected persons reported as case-patients.
To calculate incidence rates, we divided cumulative case counts by observed person-time data and multiplied by 100,000. Person-time observed was the product of the estimated population size in 2021 (28) and the number of days observed by province, variant, or both. We stratified incidence rates over the entire study period and IRR by sex, age, and variant for each province (Appendix). We analyzed data using R version 4.2.2 (https://cran.r-project.org/bin/windows/base/old/4.2.2).
Descriptive Statistics and Rt by Province
Ontario
Figure 1
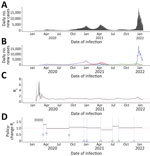
Figure 1. Daily incident COVID-19 case count and 7-day moving average Rt, by date of infection and policy-change Rtor new variants by initiation dates, Ontario, Canada, January 23,...
Ontario experienced 3 major pandemic waves during our study period; more substantial case burdens occurred in metropolitan areas. The first surge, which peaked in December 2020, was attributed to wild-type virus; the second surge, peaking in April 2021, was mainly from Alpha; and the third, peaking in December 2021, was mainly from Omicron (Figure 1; Appendix Figures 1, 2). Unlike British Columbia and Alberta, Ontario did not experience a surge because of Delta; when the Delta variant became the dominant strain in June 2021, the daily incident case count remained stable and Delta did not cause any major surges during June–December 2021, after which the Omicron variant became dominant (Figure 1). Corresponding to the sustained transmission presented in the epidemic curves, Rt was >1 during August–September 2020, February–April 2021, July–August 2021, and November–December 2021. Except for February and March 2020, Rt was not >2. Sensitivity analysis using estimated infection counts generated similar Rt trends but with a wider 95% credible interval (CrI) that included 1 throughout much of the study period time frame (Appendix Figure 3).
The policy change Rt fluctuated throughout the study period with implementation of policies and emergence of new variants (Figure 1; Table 1). Before policies were implemented, a median Rt of 1.64 (95% CrI 1.52–1.76) was observed. Initiating school closures in March 2020 (policy A), recommendation of face coverings (policy B), partial school reopening after Christmas/New Year holiday break (policy E), school closures in April 2021 (policy F), and required vaccination for government workers (policy H) were associated with decreased median Rt, whereas relaxation of policies such as phased school reopening (policy C) were associated with increased median Rt. Emergence of Delta (denoted by G) and Omicron variants (denoted by I) were associated with increased median Rt. Implementation of vaccination rollout for priority populations (policy D) was not associated with any change in median Rt. In Ontario, the most significant increase in Rt, 32.63% (95% CrI 30.22%–35.07%), was observed after the Delta variant emerged. In contrast, the greatest decrease in Rt, −24.01% (95% CrI −25.60% to −22.30%), was observed after the face covering recommendation took effect. The lowest median Rt, 0.87 (95% CrI, 0.86–0.87), during the study period was observed after school closures in April 2021.
British Columbia
Figure 2
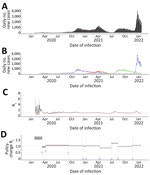
Figure 2. Daily incident COVID-19 case count and 7-day moving average Rt, by date of infection and policy-change Rtor new variants by initiation dates, British Columbia, Canada, January...
British Columbia experienced 4 major pandemic waves during our study period with greater case burden in metropolitan areas. The first surge, peaking in November 2020, was attributed to wild-type virus; the second, peaking in April 2021, mainly to Alpha; the third, peaking in September 2021, to Delta; and the fourth, peaking in December 2021, to Omicron (Figure 2; Appendix Figures 4, 5). The case counts during the Omicron surge in early December 2021 were substantially higher than during preceding months. During July–November 2020, July–August 2021, and December 2021, British Columbia experienced elevated Rt values of 1–2 (Appendix Figure 6).
As in Ontario, the median policy change Rt in British Columbia fluctuated as policies were implemented or rescinded and with emergence of new variants (Figure 2; Table 1). From the early cases to the day before school closure in March 2020, a median Rt of 1.64 (95% CrI 1.51–1.78) similar to Rt in Ontario was observed. In British Columbia, initiating school closures in March 2020 and April 2021, rollout of vaccination for priority populations and required vaccination for government workers were policies associated with decreased median Rt. In contrast, phased school reopening was associated with increased Rt. In contrast to Ontario and Alberta, in British Columbia initiating recommendation of face coverings was associated with slightly increased Rt, and partial school reopening after the holiday break did not substantially affect Rt. Delta and Omicron emergence led to increased Rt. As for Ontario, British Columbia also experienced the greatest increase in Rt, 43.85% (95% CrI 40.71%–46.84%) after Delta emerged. The greatest decrease in Rt, −42.56% (95% CrI −48.21% to −35.90%), was observed after school closures in March 2020. The lowest median Rt, 0.86 (95% CrI 0.85–0.87) was achieved after school closures in April 2021.
Alberta
Figure 3
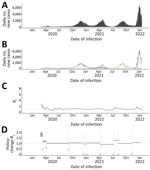
Figure 3. Daily incident COVID-19 case count and 7-day moving average Rt, by date of infection and policy-change Rtor new variants by initiation dates, Alberta, Canada, January 23,...
Similar to British Columbia, Alberta experienced 4 major pandemic waves with greater case burden in metropolitan areas. The first surge, peaking in November 2020, was attributed to wild-type virus; the second, peaking in April 2021, mainly to Alpha; the third, peaking in September 2021, to Delta; and the fourth, peaking in January 2022, to Omicron (Figure 3; Appendix Figures 7, 8). As in other provinces, Omicron led to the highest Rt in Alberta during the study period. During September–December 2020, March–May 2021, July–September 2021, and January 2022, Alberta experienced rising transmission rates peaking with Rt values of 1–2 (Appendix Figure 9).
Fluctuations in median policy change Rt in Alberta followed a trend similar to those observed in Ontario and British Columbia (Figure 3; Table 1). In Alberta, at the beginning of the study period, median Rt was 1.82 (95% CrI 1.61–2.03), higher than the initial Rt in Ontario and British Columbia. Initiating school closures in March 2020 and April 2021, recommendation of face coverings, rollout of vaccination for priority populations, and required vaccination for government workers were policies associated with decreased median Rt; policies that relaxed those interventions, such as phased school reopening and partial school reopening after holiday break were associated with increased median Rt. Emergence of Delta and Omicron variants also increased Rt. As in other provinces, the greatest increase in Rt, 40.27% (95% CrI 37.56%–42.92%), was observed after emergence of Delta, whereas the most significant decrease in Rt, −34.71% (95% CrI −42.23% to −25.80%), was observed after school closures in March 2020. Similar to other provinces, the lowest median Rt, 0.91 (95% CrI 0.90, 0.91), was observed after school closure in April 2021.
Rt by Variant
Figure 4
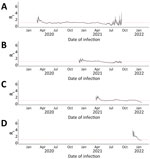
Figure 4. Seven-day sliding-window Rtby COVID-19 variant in Ontario, Canada, January 23, 2020–January 27, 2022. A) Wild-type; B) Alpha; C) Delta; D) Omicron. We estimated infection dates by subtracting 9...
Figure 5
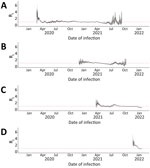
Figure 5. Seven-day sliding-window Rtby COVID-19 variant in British Columbia, Canada, January 23, 2020–January 27, 2022. A) Wild-type; B) Alpha; C) Delta; D) Omicron. We estimated infection dates by subtracting...
Figure 6
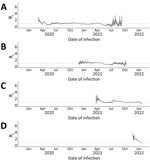
Figure 6. 7-day sliding-window Rtby COVID-19 variant in Alberta, Canada, January 23, 2020–January 27, 2022. A) Wild-type; B) Alpha; C) Delta; D) Omicron. We estimated infection dates by subtracting 9...
We calculated median 7-day sliding-window Rt by variant for Ontario (Figure 4), British Columbia (Figure 5), and Alberta (Figure 6). We note that each time a new variant emerged in each province, Rt was >1: Rt was 2–3 for wild-type, 1–2 for Alpha, ≈2 for Delta, and ≈3 for Omicron. Soon after this initial increase, Rt would decrease to ≈1. Before wild-type, Alpha, and Delta variants were overtaken by other variants, Rt would drop to <1.
IRR at the Provincial Level
We calculated the number of cases per 100,000 person-days for each variant stratified by province and for each province stratified by variant (Table 2). We observed that overall, incidence rate for Omicron was 8.742 (95% CI 8.710–8.774) times that for wild-type, which we used as referent, whereas rates were <0.7 times those for wild-type for Delta (0.692 [95% CI 0.689–0.695]) and Alpha (0.370 [95% CI 0.368–0.372]). When stratified by province, variants followed similar trends, with Omicron having a higher incidence rate and Alpha and Delta lower incidence rates than wild-type, except in British Columbia, where the incidence rate for Delta was higher than for wild-type: IRR 1.126 (95% CI 1.116–1.137). When stratified by variant, with British Columbia as the referent, Alberta had the highest IRR for all variants: wild-type, 1.927 (95% CI 1.912–1.943); Alpha, 1.734 (95% CI 1.711–1.757); Delta, 1.664 (95% CI 1.649–1.678); and Omicron, 1.827 (95% CI 1.801–1.832). Next highest IRRs were for Ontario for all variants except Delta, for which the IRR was 0.519 (95% CI 0.514, 0.524). For all variants combined, with British Columbia as the referent, Alberta (1.799 [95% CI 1.790, 1.807]) had a higher IRR than Ontario (1.117 [95% CI 1.112, 1.121]) (Appendix Tables 8, 9).
We found that daily incident case count and Rt fluctuations during the study period followed trends consistent across the 3 provinces (Figures 1–3). COVID-19 case count was highest in Ontario, followed by Alberta and British Columbia (Table 2). All 3 provinces experienced surges in case counts and increased Rt after Delta and Omicron variants emerged. Nationwide interventions included school closures, face mask recommendations, and rollout of vaccination for priority populations. Our results showed that these interventions were associated with lowered Rt, which in turn decreased COVID-19 burden. Across the 3 provinces, the school closure policy in April 2021 (policy F) corresponded with the lowest Rt during the study period; that decrease underscores the fact that social distancing, in addition to other interventions, can play a substantial role in mitigating spread. However, school closure alone was insufficient to mitigate transmission (29,30). Our results were consistent with previous studies that suggested mandating face masks (4,31), physical distancing (5), shelters in place (32), and school closures (33) have been powerful tools for controlling the pandemic. Our study confirms the critical role of high compliance by affected populations towards nonpharmaceutical interventions and other recommended measures for pandemic control before vaccines became available (34). Even after vaccine availability, emergence of new variants led to surges with Rt >1. Exhausting the numbers of susceptible persons during case surges led to declines in Rt.
Policy effectiveness was influenced by variant prevalence at any given time. In agreement with previous studies (35–37), our study showed that most cases in July–December 2021 were attributed to the Delta variant and in December 2021–January 2022 to the Omicron variant. Rt increased in all 3 provinces after emergence of Delta (label G). However, despite having the highest Delta case count, for persons in Ontario, risk of contracting Delta was least across the 3 provinces (Table 2). Also, in contrast with the other 2 provinces, emergence of Omicron did not substantially affect the policy change Rt in Ontario. Although Ontario, with its larger population, accounted for more than half of all cases across the 3 provinces, Alberta had the highest total IRR, indicating that residents had the highest risk for COVID-19 among the 3 provinces despite enacting similar mitigation policies. Attitudes and behaviors toward COVID-19 preventive measures could explain the higher total IRR in Alberta. For example, according to 1 study, during the COVID-19 pandemic, Alberta had the highest percentage of antivaccination posts (i.e., tweets) in Canada on the social media site Twitter (now X; https://twitter.com) (38).
After school closures in March 2020, British Columbia was the only one of the 3 provinces that experienced a drastic decrease in the policy change Rt, from 1.64 to 0.95 (Table 1). After the World Health Organization pandemic declaration on March 11, 2020, British Columbia was the first province to implement stringent public health responses and declare an outbreak (39). Also, among the 3 provinces, the highest Oxford Stringency Index score, a measure of adoption of government-recommended policies, was observed in British Columbia both before and after the outbreak declaration (39).
The high incidence rate for Omicron compared with wild-type could be attributed to the high contagiousness of Omicron and its ability to evade naturally acquired immunity against previous strains (40,41). The lower-than-expected IRR for Alpha might be attributable to the long duration when the variant was prevalent but not the dominant strain; higher person-time under observation for Alpha could have accounted for the lower incidence rate.
Among limitations in our study, the original data lacked information on date of infection; to account for that missing information, following a simple acceptable method (42), we estimated the approximate date of infection by subtracting 9 days (sum of the median delay in reporting and the mean incubation period) from the report date. Second, we assumed the same case-detection rate across provinces. However, if this assumption did not hold, our case burden findings would be skewed. Third, for policy change Rt, we used dates of specific major policy changes as cutoff points for each time period. In addition, because >1 nonpharmaceutical intervention could be in effect during the same period, we could not attribute changes in Rt solely to a single policy change. Fourth, we could not adjust our results to account for differences in levels of policy compliance because those data were not accessible to us. Fifth, potential variation in the availability of COVID-19 testing across the study period and among provinces could affect the daily incident case count reported and thus affect Rt estimates. Sixth, we a priori defined an SI distribution for estimating Rt. Therefore, we could not assess changes in SI because we lacked information on infector-infectee pairs. SI for SARS-CoV-2 could have been shortened over time by use of nonpharmaceutical interventions (43). We also did not assess the possibility of variant-specific SI distribution. Seventh, case count data reflected only the subset of SARS-CoV-2 infections testing positive, because many asymptomatic or mildly symptomatic infected persons were never tested. We attempted to demonstrate the effects of that uncertainty in our 7-day sliding-window Rt estimates through sensitivity analysis (Appendix Figures 3, 6, and 9). Eighth, lacking population data by public health district, we could not calculate incidence rates by district, which limited the scope of our analysis. Ninth, calculations of provincial variant incidence rates might have been influenced by the subjectively chosen length of duration for variant surges, which we based on the number of days from the index to the last reported cases for each variant in each province. Tenth, ecologic fallacy is possible in a study such as ours using aggregated data; association does not demonstrate causality.
In conclusion, we observed substantial fluctuations in Rt for COVID-19 across 3 provinces in Canada during January 2020–January 2022. Our findings showed that initiating pandemic policies, such as recommendations for face coverings, school closures, and rollout of vaccination for priority populations, were associated with decreases in Rt. Conversely, relaxing mask mandates and reopening schools were associated with increases in Rt, especially in conjunction with emergence of new SARS-CoV-2 variants. As mutated variants continue to emerge, public health authorities must remain vigilant to adapt mitigation, testing, and treatment strategies.
Mx. Kehoe is a DrPH student in epidemiology at the Georgia Southern University Jiann-Ping Hsu College of Public Health with research interests in infectious disease modeling, behavioral impacts on infectious disease transmission, and the intersection of social justice and mental health epidemiology. Dr. Mallhi earned her DrPH in epidemiology from the Georgia Southern University Jiann-Ping Hsu College of Public Health in December 2023. Her research interests include chronic disease epidemiology and women’s health.
References
- Khan M, Adil SF, Alkhathlan HZ, Tahir MN, Saif S, Khan M, et al. COVID-19: a global challenge with old history, epidemiology and progress so far. Molecules. 2020;26:39. DOIPubMedGoogle Scholar
- Centers for Disease Control and Prevention. SARS-COV-2 variant classifications and definitions [cited 2022 May 3]. https://www.cdc.gov/coronavirus/2019-ncov/variants/variant-classifications.html
- Sah P, Vilches TN, Moghadas SM, Fitzpatrick MC, Singer BH, Hotez PJ, et al. Accelerated vaccine rollout is imperative to mitigate highly transmissible COVID-19 variants. EClinicalMedicine. 2021;35:
100865 . DOIPubMedGoogle Scholar - Karaivanov A, Lu SE, Shigeoka H, Chen C, Pamplona S. Face masks, public policies and slowing the spread of COVID-19: Evidence from Canada. J Health Econ. 2021;78:
102475 . DOIPubMedGoogle Scholar - Tuite AR, Greer AL, De Keninck S, Fisman DN. Risk for COVID-19 resurgence related to duration and effectiveness of physical distancing in Ontario, Canada. Ann Intern Med. 2020;173:675–8. DOIPubMedGoogle Scholar
- Tuite AR, Fisman DN, Greer AL. Mathematical modelling of COVID-19 transmission and mitigation strategies in the population of Ontario, Canada. CMAJ. 2020;192:E497–505. DOIPubMedGoogle Scholar
- Yuan P, Li J, Aruffo E, Gatov E, Li Q, Zheng T, et al. Efficacy of a “stay-at-home” policy on SARS-CoV-2 transmission in Toronto, Canada: a mathematical modelling study. CMAJ Open. 2022;10:E367–78. DOIPubMedGoogle Scholar
- Adeyinka DA, Neudorf C, Camillo CA, Marks WN, Muhajarine N. COVID-19 vaccination and public health countermeasures on variants of concern in Canada: evidence from a spatial hierarchical cluster analysis. JMIR Public Health Surveill. 2022;8:
e31968 . DOIPubMedGoogle Scholar - Périnet S, Cadieux G, Mercure SA, Drouin M, Allard R. Analysis of COVID-19 risk following a ring vaccination intervention to address SARS-CoV-2 alpha variant transmission in Montreal, Canada. JAMA Netw Open. 2022;5:
e2147042 . DOIPubMedGoogle Scholar - Fung IC-H, Hung YW, Ofori SK, Muniz-Rodriguez K, Lai P-Y, Chowell G. SARS-CoV-2 Transmission in Alberta, British Columbia, and Ontario, Canada, December 25, 2019, to December 1, 2020. Disaster Med Public Health Prep. 2021;16:1–10.PubMedGoogle Scholar
- Government of Ontario. Confirmed positive cases of COVID-19 in Ontario [cited 2022 Jan 28]. https://data.ontario.ca/dataset/confirmed-positive-cases-of-covid-19-in-ontario
- Ontario Health. Annual business plan 2022/23 [cited 2023 Feb 6]. https://www.ontariohealth.ca/sites/ontariohealth/files/2022-05/OHBusinessPlan22_23.pdf
- British Columbia Centre for Disease Control. Archived BC COVID-19 data [cited 2022 Jan 28]. http://www.bccdc.ca/health-info/diseases-conditions/covid-19/archived-b-c-covid-19-data
- Government of British Columbia. Regional health authorities [cited 2022 Sep 10]. https://www2.gov.bc.ca/gov/content/health/about-bc-s-health-care-system/partners/health-authorities/regional-health-authorities
- Government of Alberta. COVID-19 Alberta statistics 2020 [cited 2022 Jan 28]. https://web.archive.org/web/20220128231728/https://www.alberta.ca/stats/covid-19-alberta-statistics.htm
- Alberta Health Services. AHS map and zone overview. 2020–21: report to the community [cited 2022 Sep 10]. https://www.albertahealthservices.ca/assets/about/publications/ahs-ar-2021/zones.html
- Government of Canada, Department of Justice, Electronic Communication. Government of Canada's response to COVID-19 [cited 2022 May 2]. https://www.justice.gc.ca/eng/csj-sjc/covid.html#shr-pg0
- Canadian Institute of Health Information. Canadian COVID-19 intervention timeline [cited 2022 May 2]. https://www.cihi.ca/en/covid-19-intervention-timeline-in-canada
- Upper Canada District School Board. 2021–2022 school year calendar [cited 2022 May 18]. https://web.archive.org/web/20220518125851/https://www.ucdsb.on.ca/for_families/school_year_calendar
- Government of Canada. COVID-19 epidemiology update [cited 2022 May 2]. https://health-infobase.canada.ca/covid-19/epidemiological-summary-covid-19-cases.html
- Guerra FM, Bolotin S, Lim G, Heffernan J, Deeks SL, Li Y, et al. The basic reproduction number (R0) of measles: a systematic review. Lancet Infect Dis. 2017;17:e420–8. DOIPubMedGoogle Scholar
- Ogwara CA, Mallhi AK, Hua X, Muniz-Rodriguez K, Schwind JS, Zhou X, et al. Spatially refined time-varying reproduction numbers of COVID-19 by health district in Georgia, USA, March–December 2020. Epidemiologia (Basel). 2021;2:179–97. DOIPubMedGoogle Scholar
- Cori A, Ferguson NM, Fraser C, Cauchemez S. A new framework and software to estimate time-varying reproduction numbers during epidemics. Am J Epidemiol. 2013;178:1505–12. DOIPubMedGoogle Scholar
- Thompson RN, Stockwin JE, van Gaalen RD, Polonsky JA, Kamvar ZN, Demarsh PA, et al. Improved inference of time-varying reproduction numbers during infectious disease outbreaks. Epidemics. 2019;29:
100356 . DOIPubMedGoogle Scholar - You C, Deng Y, Hu W, Sun J, Lin Q, Zhou F, et al. Estimation of the time-varying reproduction number of COVID-19 outbreak in China. Int J Hyg Environ Health. 2020;228:
113555 . DOIPubMedGoogle Scholar - Centers for Disease Control and Prevention. Estimated COVID-19 burden [cited 2022 Aug 28]. https://stacks.cdc.gov/view/cdc/117147
- Centers for Disease Control and Prevention. COVID-19 pandemic planning scenarios [cited 2022 Aug 28]. https://www.cdc.gov/coronavirus/2019-ncov/hcp/planning-scenarios.html
- Statistics Canada. Census profile, 2021 census of population [cited 2022 June 25]. https://www12.statcan.gc.ca/census-recensement/2021/dp-pd/prof/index.cfm
- Esposito S, Principi N. School closure during the coronavirus disease 2019 (COVID-19) pandemic: an effective intervention at the global level? JAMA Pediatr. 2020;174:921–2. DOIPubMedGoogle Scholar
- Lee B, Raszka WV Jr. COVID-19 transmission and children: the child is not to blame. Pediatrics. 2020;146:
e2020004879 . DOIPubMedGoogle Scholar - Ueki H, Furusawa Y, Iwatsuki-Horimoto K, Imai M, Kabata H, Nishimura H, et al. Effectiveness of face masks in preventing airborne transmission of SARS-CoV-2. MSphere. 2020;5:e00637–20. DOIPubMedGoogle Scholar
- Feyman Y, Bor J, Raifman J, Griffith KN. Effectiveness of COVID-19 shelter-in-place orders varied by state. PLoS One. 2020;15:
e0245008 . DOIPubMedGoogle Scholar - Abdollahi E, Haworth-Brockman M, Keynan Y, Langley JM, Moghadas SM. Simulating the effect of school closure during COVID-19 outbreaks in Ontario, Canada. BMC Med. 2020;18:230. DOIPubMedGoogle Scholar
- Kwok KO, Li KK, Tang A, Tsoi MTF, Chan EYY, Tang JWT, et al. Psychobehavioral responses and likelihood of receiving COVID-19 vaccines during the pandemic, Hong Kong. Emerg Infect Dis. 2021;27:1802–10. DOIPubMedGoogle Scholar
- Mohapatra RK, Tiwari R, Sarangi AK, Sharma SK, Khandia R, Saikumar G, et al. Twin combination of Omicron and Delta variants triggering a tsunami wave of ever high surges in COVID-19 cases: A challenging global threat with a special focus on the Indian subcontinent. J Med Virol. 2022;94:1761–5. DOIPubMedGoogle Scholar
- Klompas M, Karan A. Preventing SARS-CoV-2 transmission in health care settings in the context of the Omicron variant. JAMA. 2022;327:619–20. DOIPubMedGoogle Scholar
- Wee LE, Ko KK-K, Conceicao EP, Sim JX-Y, Rahman NA, Tan SY-L, et al. Linking sporadic hospital clusters during a community surge of the severe acute respiratory coronavirus virus 2 (SARS-CoV-2) B.1.617.2 delta variant: The utility of whole-genome sequencing. Infect Control Hosp Epidemiol. 2023;44:1014–8. DOIPubMedGoogle Scholar
- To QG, To KG, Huynh VN, Nguyen NT, Ngo DT, Alley S, et al. Anti-vaccination attitude trends during the COVID-19 pandemic: A machine learning-based analysis of tweets. Digit Health. 2023;9:
20552076231158033 . DOIPubMedGoogle Scholar - McCoy LG, Smith J, Anchuri K, Berry I, Pineda J, Harish V, et al.; COVID-19 Canada Open Data Working Group: Non-Pharmaceutical Interventions. Characterizing early Canadian federal, provincial, territorial and municipal nonpharmaceutical interventions in response to COVID-19: a descriptive analysis. CMAJ Open. 2020;8:E545–53. DOIPubMedGoogle Scholar
- Okpeku M. Possibility of COVID-19 eradication with evolution of a new omicron variant. Infect Dis Poverty. 2022;11:30. DOIPubMedGoogle Scholar
- Pulliam JRC, van Schalkwyk C, Govender N, von Gottberg A, Cohen C, Groome MJ, et al. Increased risk of SARS-CoV-2 reinfection associated with emergence of Omicron in South Africa. Science. 2022;376:
eabn4947 . DOIPubMedGoogle Scholar - Gostic KM, McGough L, Baskerville EB, Abbott S, Joshi K, Tedijanto C, et al. Practical considerations for measuring the effective reproductive number, Rt. PLOS Comput Biol. 2020;16:
e1008409 . DOIPubMedGoogle Scholar - Ali ST, Wang L, Lau EHY, Xu X-K, Du Z, Wu Y, et al. Serial interval of SARS-CoV-2 was shortened over time by nonpharmaceutical interventions. Science. 2020;369:1106–9. DOIPubMedGoogle Scholar
Figures
Tables
Cite This ArticleOriginal Publication Date: April 08, 2024
1These first authors contributed equally to this article.
2These second authors contributed equally to this article.
Table of Contents – Volume 30, Number 5—May 2024
| EID Search Options |
|---|
|
|
|
|
|
|
Please use the form below to submit correspondence to the authors or contact them at the following address:
Isaac Chun-Hai Fung, PO Box 7989, Department of Biostatistics, Epidemiology and Environmental Health Sciences, Jiann-Ping Hsu College of Public Health, Georgia Southern University, Statesboro, GA 30460, USA
Top