Skip directly to site content Skip directly to page options Skip directly to A-Z link Skip directly to A-Z link Skip directly to A-Z link

Disclaimer: Early release articles are not considered as final versions. Any changes will be reflected in the online version in the month the article is officially released.

Volume 30, Number 6—June 2024
Dispatch

Evolution and Antigenic Differentiation of Avian Influenza A(H7N9) Virus, China

Yang Liu1, Yuhua Chen1, Zhiyi Yang, Yaozhong Lin, Siyuan Fu, Junhong Chen, Lingyu Xu, Tengfei Liu, Beibei Niu, Qiuhong Huang, Haixia Liu, Chaofeng Zheng, Ming LiaoComments to Author , and Weixin JiaComments to Author 
Author affiliations: South China Agricultural University, Guangzhou, China (Y. Liu, Y. Chen, Z. Yang, Y. Lin, S. Fu, J. Chen, L. Xu, T. Liu, B. Niu, Q. Huang, M. Liao, W. Jia); Guangzhou Institute of Animal Health, Guangzhou (Y. Chen); Guangdong Aib Polytechnic College, Guangzhou (H. Liu); Animal Husbandry and Veterinary Station, Urumqi, China (C. Zheng)

Main Article

Figure 1

Phylogenetic analysis of evolution and antigenic differentiation of avian influenza A(H7N9) virus, China. Colors in columns at left show locations, timeframes, hosts, and pathogenicity of virus strains. The maximum-likelihood phylogenetic tree of the hemagglutinin gene depicts viruses corresponding to epidemic waves 1–5. Tree on right shows detail of Group.y.2.3 (red rectangles) and Group.y.2.4.4 (red circles) in comparison with vaccine strains. Scale bar indicates nucleotide substitutions per site. LPAI, low-pathogenicity avian influenza; HPAI, highly pathogenic avian influenza; Other-N, sites in the northern region; Other-S, sites in the southern region.

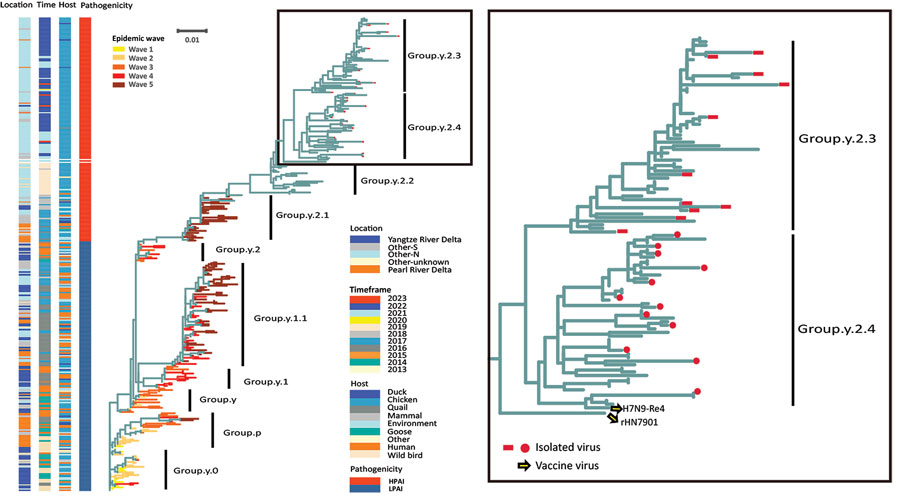
Figure 1. Phylogenetic analysis of evolution and antigenic differentiation of avian influenza A(H7N9) virus, China. Colors in columns at left show locations, timeframes, hosts, and pathogenicity of virus strains. The maximum-likelihood phylogenetic tree of the hemagglutinin gene depicts viruses corresponding to epidemic waves 1–5. Tree on right shows detail of Group.y.2.3 (red rectangles) and Group.y.2.4.4 (red circles) in comparison with vaccine strains. Scale bar indicates nucleotide substitutions per site. LPAI, low-pathogenicity avian influenza; HPAI, highly pathogenic avian influenza; Other-N, sites in the northern region; Other-S, sites in the southern region.

Main Article

1These first authors contributed equally to this article.

Page created: April 03, 2024
Page updated: April 19, 2024
Page reviewed: April 19, 2024
The conclusions, findings, and opinions expressed by authors contributing to this journal do not necessarily reflect the official position of the U.S. Department of Health and Human Services, the Public Health Service, the Centers for Disease Control and Prevention, or the authors' affiliated institutions. Use of trade names is for identification only and does not imply endorsement by any of the groups named above.
file_external