Volume 9, Number 6—June 2003
Research
Molecular Subtyping to Detect Human Listeriosis Clusters
Figure 2
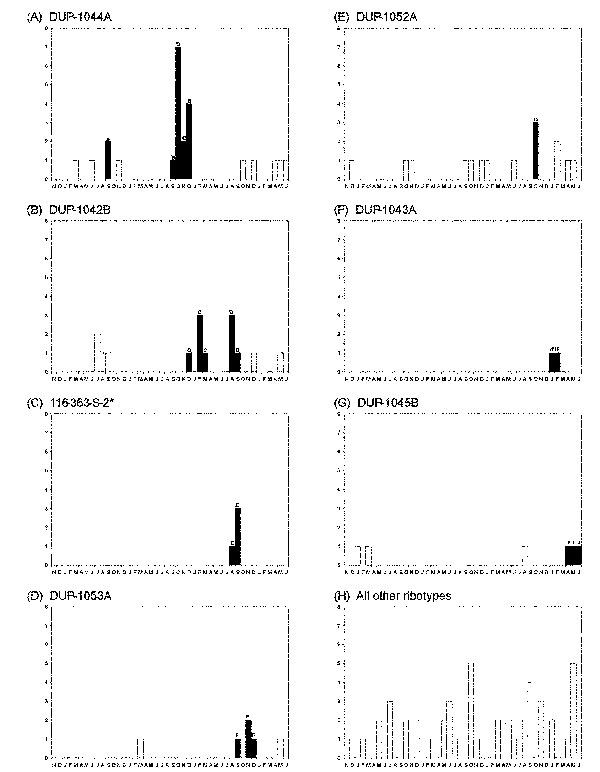
Figure 2. Temporal distribution of listeriosis clusters detected based on ribotype or pulsed-field gel electrophoresis (PFGE) data, using a 3-month window scan statistic. Panels A–G each show the distribution of cases caused by a specific ribotype, ribotypes are denoted in the header of each panel. For panel C, one case caused by ribotype DUP-1044B is included with cases caused by ribotype 116-363-S-2 based on a PFGE match (Table 1, cluster E). Cases, which are part of statistically significant ribotype or PFGE clusters are denoted by dark bars and labeled by cluster designation (A–I, see Table 1). Open bars indicate cases that were not part of a cluster detected by the scan statistics. Panel H shows human cases, which did not represent clusters and were not caused by any of the ribotypes shown in panels A–G. The X-axis of each panel represents November 1996 to June 2000.