Volume 20, Number 4—April 2014
Research
Rapid Increase in Pertactin-deficient Bordetella pertussis Isolates, Australia
Connie Lam, Sophie Octavia, Lawrence Ricafort, Vitali Sintchenko, Gwendolyn L. Gilbert, Nicholas Wood, Peter McIntyre, Helen Marshall, Nicole Guiso, Anthony D. Keil, Andrew Lawrence, Jenny Robson, Geoff Hogg, and Ruiting Lan
Figure 2
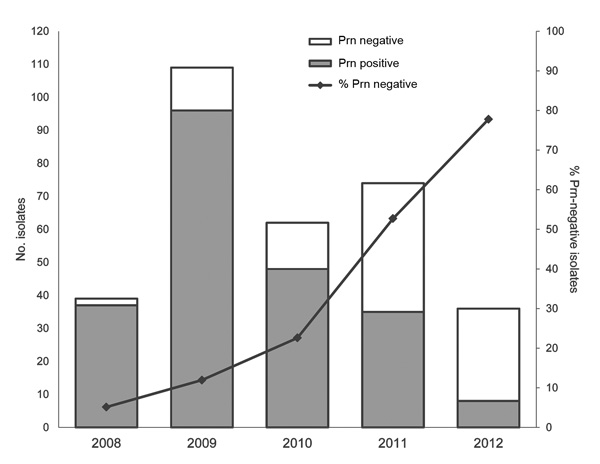
Figure 2. Number and percentage of pertactin (Prn)–negative Bordetella pertussis isolates in Australia, 2008–2012. During this period, 320 B. pertussis isolates obtained in New South Wales, Queensland, South Australia, Victoria, and Western Australia were identified as expressing prn or not expressing prn by using Western immunoblotting. The increasing percentage of prn-negative isolates each year during 2008–2012 was 5%, 12%, 23%, 53%, and 78% respectively. Data for individual states and years can be found in the Table. Gray bars indicate number of isolates expressing prn, and white bars indicate number of isolates not expressing prn. Error bars indicate 95% CIs.
Page created: February 07, 2014
Page updated: March 19, 2014
Page reviewed: March 19, 2014
The conclusions, findings, and opinions expressed by authors contributing to this journal do not necessarily reflect the official position of the U.S. Department of Health and Human Services, the Public Health Service, the Centers for Disease Control and Prevention, or the authors' affiliated institutions. Use of trade names is for identification only and does not imply endorsement by any of the groups named above.