Skip directly to site content Skip directly to page options Skip directly to A-Z link Skip directly to A-Z link Skip directly to A-Z link
Volume 24, Number 1—January 2018
Research

Geogenomic Segregation and Temporal Trends of Human Pathogenic Escherichia coli O157:H7, Washington, USA, 2005–20141

Gillian A.M. TarrComments to Author , Smriti Shringi, Amanda I. Phipps, Thomas E. Besser, Jonathan Mayer, Hanna N. Oltean, Jon Wakefield, Phillip I. Tarr, and Peter Rabinowitz
Author affiliations: University of Calgary, Calgary, Alberta, Canada (G.A.M. Tarr); Washington State University, Pullman, Washington, USA (S. Shringi, T.E. Besser); University of Washington, Seattle, Washington, USA (A.I. Phipps, J. Mayer, J. Wakefield, P. Rabinowitz); Washington State Department of Health, Shoreline, Washington, USA (H.N. Oltean); Washington University School of Medicine, St. Louis, Missouri, USA (P.I. Tarr)

Main Article

Figure 2

Risk surface of Escherichia coli O157:H7 lineage IIb relative to lineage Ib using a multinomial generalized additive model and a bivariate thin plate smooth function for longitude and latitude for culture-confirmed human cases reported in Washington, USA, 2005–2014. The black contour lines show the mean effect estimate for lineage IIb relative to Ib as latitude and longitude change. The 0-marked black line indicates no effect. The 1-marked black line indicates greater proportional incidence of l

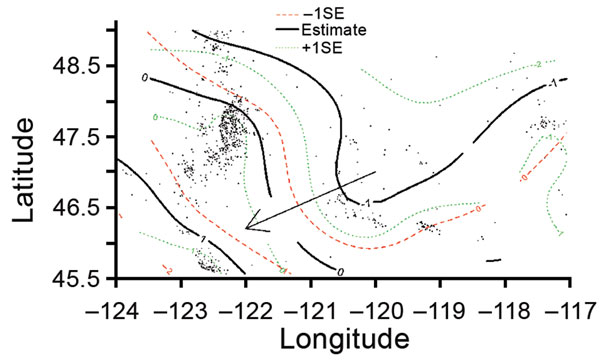
Figure 2. Risk surface of Escherichia coli O157:H7 lineage IIb relative to lineage Ib using a multinomial generalized additive model and a bivariate thin plate smooth function for longitude and latitude for culture-confirmed human cases reported in Washington, USA, 2005–2014. The black contour lines show the mean effect estimate for lineage IIb relative to Ib as latitude and longitude change. The 0-marked black line indicates no effect. The 1-marked black line indicates greater proportional incidence of lineage IIb toward the southwest corner of the area as compared to lineage Ib (p<0.001). The arrow indicates the general direction of the trend from higher Ib risk to higher IIb risk. Dashed red lines show the effect estimate 1 standard error (SE) below (to the south and west) the mean estimate. Dotted green lines show the effect estimate 1 standard error above (to the north and east) the mean estimate.

Main Article

1Preliminary results from this study were presented at the International Meeting on Emerging Diseases and Surveillance (IMED), November 4–7, 2016, Vienna, Austria.

Page created: December 19, 2017
Page updated: December 19, 2017
Page reviewed: December 19, 2017
The conclusions, findings, and opinions expressed by authors contributing to this journal do not necessarily reflect the official position of the U.S. Department of Health and Human Services, the Public Health Service, the Centers for Disease Control and Prevention, or the authors' affiliated institutions. Use of trade names is for identification only and does not imply endorsement by any of the groups named above.
file_external