Skip directly to site content Skip directly to page options Skip directly to A-Z link Skip directly to A-Z link Skip directly to A-Z link
Volume 24, Number 1—January 2018
Research

Changing Geographic Patterns and Risk Factors for Avian Influenza A(H7N9) Infections in Humans, China

Jean Artois1, Hui Jiang1, Xiling Wang, Ying Qin, Morgan Pearcy, Shengjie Lai, Yujing Shi, Juanjuan Zhang, Zhibin Peng, Jiandong Zheng, Yangni He, Madhur S. Dhingra, Sophie von Dobschuetz, Fusheng Guo, Vincent Martin, Wantanee Kalpravidh, Filip Claes, Timothy Robinson, Simon I. Hay, Xiangming Xiao, Luzhao Feng, Sheng WeiComments to Author , and Hongjie YuComments to Author 
Author affiliations: Université Libre de Bruxelles, Brussels, Belgium (J. Artois, M. Pearcy, M.S. Dhingra, M. Gilbert); Chinese Center for Disease Control and Prevention, Beijing, China (H. Jiang, Y. Qin, S. Lai, Y. Shi, Z. Peng, J. Zheng, L. Feng, H. Yu); Fudan University School of Public Health, Key Laboratory of Public Health Safety, Ministry of Education, Shanghai, China (X. Wang, S. Lai, J. Zhang, Y. He, X. Xiao, H. Yu); Fonds National de la Recherche Scientifique, Brussels, Belgium (M. Pearcy, M. Gilbert); University of Southampton, Southampton, UK (S. Lai); Food and Agriculture Organization of the United Nations, Rome, Italy (M.S. Dhingra, S. von Dobschuetz, T. Robinson); Food and Agriculture Organization of the United Nations Regional Office for Asia and the Pacific, Bangkok, Thailand (F. Guo, W. Kalpravidh, F. Claes); Food and Agriculture Organization of the United Nations China Office, Beijing (V. Martin); University of Washington, Seattle, Washington, USA (S.I. Hay); University of Oxford, Oxford, UK (S.I. Hay); University of Oklahoma, Norman, Oklahoma, USA (X. Xiao)

Main Article

Figure 2

Distribution of predictor variables and influenza A(H7N9) infections in China, with 3 geographic extents: smallest extent around the location of human cases (top), Guangdong Province (bottom left), and Yangtze River Delta (bottom right). A) Visualization of poultry density (red), live-poultry market density (green), and chicken-to-duck ratio (blue). Dark areas correspond to low values and light areas to high values in all 3 predictors. B) Number of years with >1 human case per county. C) Dist

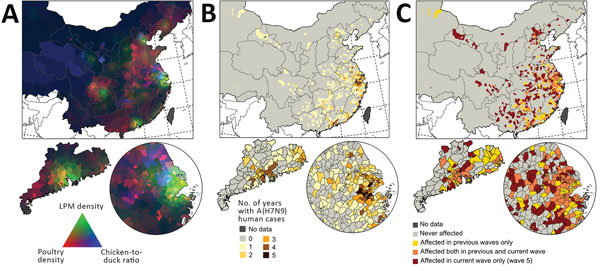
Figure 2. Distribution of predictor variables and influenza A(H7N9) infections in China, with 3 geographic extents: smallest extent around the location of human cases (top), Guangdong Province (bottom left), and Yangtze River Delta (bottom right). A) Visualization of poultry density (red), live-poultry market density (green), and chicken-to-duck ratio (blue). Dark areas correspond to low values and light areas to high values in all 3 predictors. B) Number of years with >1 human case per county. C) Distribution of the fifth wave of human infections compared with previous waves.

Main Article

1These authors contributed equally to this article.

Page created: December 19, 2017
Page updated: December 19, 2017
Page reviewed: December 19, 2017
The conclusions, findings, and opinions expressed by authors contributing to this journal do not necessarily reflect the official position of the U.S. Department of Health and Human Services, the Public Health Service, the Centers for Disease Control and Prevention, or the authors' affiliated institutions. Use of trade names is for identification only and does not imply endorsement by any of the groups named above.
file_external