Epidemic Dynamics of Vibrio parahaemolyticus Illness in a Hotspot of Disease Emergence, Galicia, Spain
Jaime Martinez-Urtaza

, Joaquin Trinanes, Michel Abanto, Antonio Lozano-Leon, Jose Llovo-Taboada, Marta Garcia-Campello, Anxela Pousa, Andy Powell, Craig Baker-Austin, and Narjol Gonzalez-Escalona
Author affiliations: Centre for Environment Fisherie,s and Aquaculture Science, Weymouth, Dorset, UK (J. Martinez-Urtaza, A. Powell, C. Baker-Austin); Universidad de Santiago de Compostela, Santiago de Compostela, Spain (J. Trinanes); National Oceanic and Atmospheric Administration, Atlantic Oceanographic and Meteorological Laboratory, Miami, Florida, USA (J. Trinanes); University of Miami, Miami (J. Trinanes); University of La Frontera, Temuco, Chile (M. Abanto); Laboratory ASMECRUZ, Bueu, Spain (A. Lozano-Leon); Hospital Clínico Universitario de Santiago de Compostela, Santiago de Compostela (J. Llovo-Taboada); Complexo Hospitalario de Pontevedra, Pontevedra, Spain (M. Garcia-Campello); Direccion Xeral de Innovación e Xestión da Saúde Pública, Consellería de Sanidade, Xunta de Galicia, Galicia, Spain (A. Pousa, A. Powell); US Food and Drug Administration, College Park, Maryland, USA (N. Gonzalez-Escalona)
Main Article
Figure 3
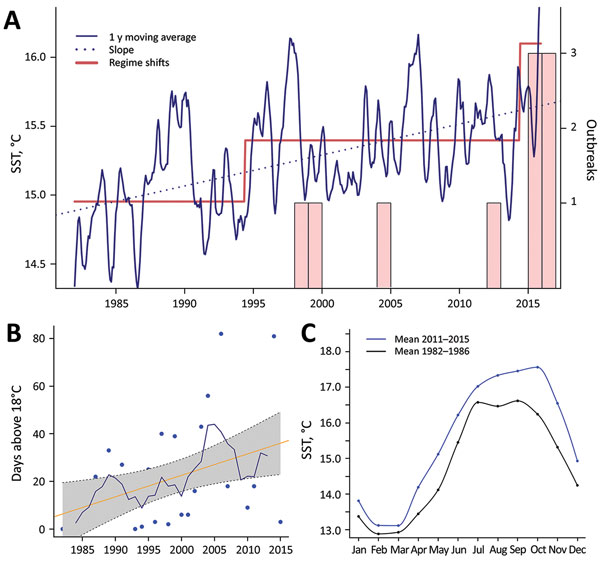
Figure 3. Recent environmental warming trends in Galicia, Spain, 1982–2016. Trends in the mean values of SST were estimated using daily SST data from a coastal area defined by the coordinates 42°–43°N and 8.5°–9.5°W. A) Mean SST records show stepwise changes rather than a linear pattern. Two regime shifts occurred in June 1994 (0.4°C warming) and June 2014 (0.7°C), which correspond with the first emergence of Vibrio parahaemolyticus cases and the epidemiologic shifts observed for 2015 and 2016. B) Number of days with SST >18°C (blue dot), 5-year moving average (blue line), and regression line (yellow line); slope is of ≈1 d/y (e.g., gaining 1 d/y). C) Mean SST data for Galicia for 2 periods, demonstrating the generalized warming and expansion of season with favorable conditions for sustaining Vibrio organisms in the environment and hence increasing risk of infection. SST, sea surface temperature.
Main Article
Page created: April 17, 2018
Page updated: April 17, 2018
Page reviewed: April 17, 2018
The conclusions, findings, and opinions expressed by authors contributing to this journal do not necessarily reflect the official position of the U.S. Department of Health and Human Services, the Public Health Service, the Centers for Disease Control and Prevention, or the authors' affiliated institutions. Use of trade names is for identification only and does not imply endorsement by any of the groups named above.