Volume 25, Number 1—January 2019
Research
Variable Protease-Sensitive Prionopathy Transmission to Bank Voles
Figure 2
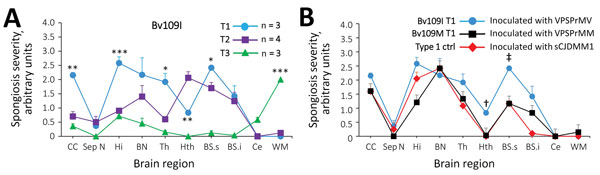
Figure 2. Profiles of topographic distribution and severity of spongiform degeneration in the brains of bank voles harboring T1–T3 phenotypes after inoculation with brain homogenate from variably protease sensitive prionopathy (VPSPr) and control bank voles inoculated with sCJD. A) Spongiform degeneration characterized both T1 and T2 phenotypes but displayed significantly divergent distributions in 5 of the 10 anatomic locations examined; spongiform degeneration affected primarily the cerebral cortex in T1 and the hypothalamus and brain stem in T2; no difference in vacuolar mean diameter was observed between T1 and T2. Spongiform degeneration scores associated with the T3 phenotype were minimal or absent in most locations except for the white matter, especially in the corpus callosum, which was virtually unaffected in T1 and T2. *p<0.5; **p<0.006; ***p<0.0001 of T1 versus T2 and T3 WM versus T1 and T2; inocula: T1 and T2 VPSPr-129MV, T3 VPSPr-129MM; vacuoles measured (n = ≈2,000) in T1 and T2 combined. B) Comparative study of T1 profiles generated in bv109M and bv109I revealed an overall more severe spongiform degeneration in bv109I but no significant difference in distribution (†, p<0.001, ‡, p<0.003; N=3 Bv109I and Bv109M). The T1 spongiform degeneration profile generated by bv109M after inoculation with VPSPr-129MM reproduced the profile generated with sCJDMM1 extracts used as control for human type 1 (bv109M N = 3 for each profile). Similar results were obtained when comparing the T1 profile of bv109I inoculated with VPSPr-129MV and profiles of bv109I inoculated with sCJDMV1 (data not shown). BN, basal nuclei; BSs and BSi, brainstem superior and inferior; bv, bank vole; CC, cerebral cortex; Ce, cerebellum; ctrl, control; Hi, hippocampus; Hth:, hypothalamus; sCJD, sporadic Creutzfeldt-Jakob disease; Sept.N, septal nuclei; Th, thalamus; WM, white matter.
1These authors contributed equally to this article.