Zoonotic Source Attribution of Salmonella enterica Serotype Typhimurium Using Genomic Surveillance Data, United States
Shaokang Zhang, Shaoting Li, Weidong Gu, Henk den Bakker, Dave Boxrud, Angie Taylor, Chandler Roe, Elizabeth Driebe, David M. Engelthaler, Marc Allard, Eric Brown, Patrick McDermott, Shaohua Zhao, Beau B. Bruce, Eija Trees, Patricia I. Fields, and Xiangyu Deng

Author affiliations: University of Georgia Center for Food Safety, Griffin, Georgia, USA (S. Zhang, S. Li, H. den Bakker, X. Deng); Centers for Disease Control and Prevention, Atlanta, Georgia, USA (W. Gu, B.B. Bruce, E. Trees, P.I. Fields); Minnesota Department of Health, St. Paul, Minnesota, USA (D. Boxrud, A. Taylor); Translational Genomics Research Institute, Flagstaff, Arizona, USA (C. Roe, E. Driebe, D.M. Engelthaler); US Food and Drug Administration, College Park, Maryland, USA (M. Allard, E.W. Brown); US Food and Drug Administration, Laurel, Maryland, USA (P. McDermott, S. Zhao)
Main Article
Figure 1
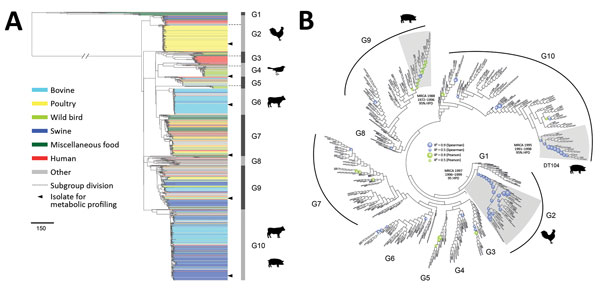
Figure 1. Phylogenetic structure of 1,267 Salmonella enterica serotype Typhimurium isolates. A) Maximum-likelihood phylogeny from 46 US states and 39 other countries. The tree was rooted at midpoint. Ten major population groups (G1–G10) were delineated. Each dashed line shows the division of subgroups in G2, G3, G4, and G5 (e.g., G2a and G2b). Each isolate is color coded by source. Arrowheads indicate isolates selected for metabolic profiling using Phenotype Microarrays (Biolog, https://biolog.com). Scale bar indicates number of single-nucleotide polymorphisms. B) Circular cladogram of the same maximum-likelihood phylogeny of the 1,267 isolates. Colored circles indicate internal nodes that had a squared coefficient (R2) of the Spearman or Pearson correlation between isolation years and branch lengths >0.4. The sizes of the circle are proportional to the values of R2 (0.0–0.9). Clades identified to exhibit temporal signals of single-nucleotide polymorphisms accumulation are shaded in gray. The inferred MRCA age of each clade is shown. HPD, highest posterior density; MRCA, most recent common ancestor.
Main Article
Page created: December 18, 2018
Page updated: December 18, 2018
Page reviewed: December 18, 2018
The conclusions, findings, and opinions expressed by authors contributing to this journal do not necessarily reflect the official position of the U.S. Department of Health and Human Services, the Public Health Service, the Centers for Disease Control and Prevention, or the authors' affiliated institutions. Use of trade names is for identification only and does not imply endorsement by any of the groups named above.