Zoonotic Source Attribution of Salmonella enterica Serotype Typhimurium Using Genomic Surveillance Data, United States
Shaokang Zhang, Shaoting Li, Weidong Gu, Henk den Bakker, Dave Boxrud, Angie Taylor, Chandler Roe, Elizabeth Driebe, David M. Engelthaler, Marc Allard, Eric Brown, Patrick McDermott, Shaohua Zhao, Beau B. Bruce, Eija Trees, Patricia I. Fields, and Xiangyu Deng

Author affiliations: University of Georgia Center for Food Safety, Griffin, Georgia, USA (S. Zhang, S. Li, H. den Bakker, X. Deng); Centers for Disease Control and Prevention, Atlanta, Georgia, USA (W. Gu, B.B. Bruce, E. Trees, P.I. Fields); Minnesota Department of Health, St. Paul, Minnesota, USA (D. Boxrud, A. Taylor); Translational Genomics Research Institute, Flagstaff, Arizona, USA (C. Roe, E. Driebe, D.M. Engelthaler); US Food and Drug Administration, College Park, Maryland, USA (M. Allard, E.W. Brown); US Food and Drug Administration, Laurel, Maryland, USA (P. McDermott, S. Zhao)
Main Article
Figure 2
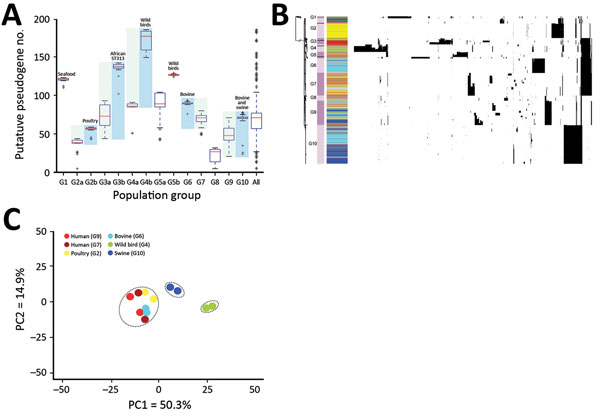
Figure 2. Pseudogene accumulation and metabolic acclimation of Salmonella enterica serotype Typhimurium. A) Abundance of putative pseudogenes in each individual population group or subgroup. Colors indicate each pair of recently diverged clades: light blue indicates source-associated clade; light green indicates diverse-source clade. B) Distribution of putative pseudogenes among Salmonella Typhimurium genomes by source. Cyan, bovine; yellow, poultry; light green, wild bird; blue, swine; dark green, miscellaneous food; red, human; gray, other sources. Purple bars delineate different population groups; black lines within these bars indicate subgroup divisions: G2a and G2b, G3a and G3b, G4a and G4b, and G5a and G5b. The presence of a pseudogene in an isolate is shown as a black spot in the corresponding location. Horizontally, these pseudogenes are hierarchically clustered on the basis of their distribution among analyzed isolates. C) Principal component analysis of metabolic profiles of selected isolates. Results from 2 replicate Phenotype Microarray (Biolog, https://biolog.com) analyses are shown for each isolate. PC, principal component.
Main Article
Page created: December 18, 2018
Page updated: December 18, 2018
Page reviewed: December 18, 2018
The conclusions, findings, and opinions expressed by authors contributing to this journal do not necessarily reflect the official position of the U.S. Department of Health and Human Services, the Public Health Service, the Centers for Disease Control and Prevention, or the authors' affiliated institutions. Use of trade names is for identification only and does not imply endorsement by any of the groups named above.