Skip directly to site content Skip directly to page options Skip directly to A-Z link Skip directly to A-Z link Skip directly to A-Z link
Volume 25, Number 10—October 2019
Research

Early Diagnosis of Tularemia by Flow Cytometry, Czech Republic, 2003–20151

Aleš ChrdleComments to Author , Pavlína Tinavská, Olga Dvořáčková, Pavlína Filipová, Věra Hnetilová, Pavel Žampach, Květoslava Batistová, Václav Chmelík, Amanda E. Semper, and Nick J. Beeching
Author affiliations: České Budějovice Hospital, České Budějovice, Czech Republic (A. Chrdle, P. Tinavská, P. Filipová, V. Hnetilová, P. Žampach, V. Chmelík); University of South Bohemia Faculty of Health and Social Sciences, České Budějovice, Czech Republic (A. Chrdle, O. Dvořáčková); Royal Liverpool University Hospital, Liverpool, UK (A. Chrdle, N.J. Beeching); Písek Hospital, Písek, Czech Republic (K. Batistová); Public Health England, Porton Down, UK (A.E. Semper); National Institute for Health Research Health Protection Research Unit in Emerging and Zoonotic Infections, Liverpool, UK (A.E. Semper; N.J. Beeching); Liverpool School of Tropical Medicine, Liverpool (N.J. Beeching)

Main Article

Figure 1

Flow cytometry gating strategy used to determine percentage of CD3+ lymphocytes that are CD3+/CD4–/CD8– T cells and γδ T cells in peripheral blood samples acquired from patients with suspected tularemia, Czech Republic, 2003–2015. A–C) Staining with CYTO-STAT tetraCHROME CD45-FITC/CD56-RD1 (phycoerythrin)/CD19-ECD/CD3-PC5, anti–CD4-Alexa Fluor 750, and anti–CD8-PC7 (Beckman Coulter, https://www.beckmancoulter.com). A) CD45 versus side scatter plot. Percentages of lymphocytes (red), monocytes (gr

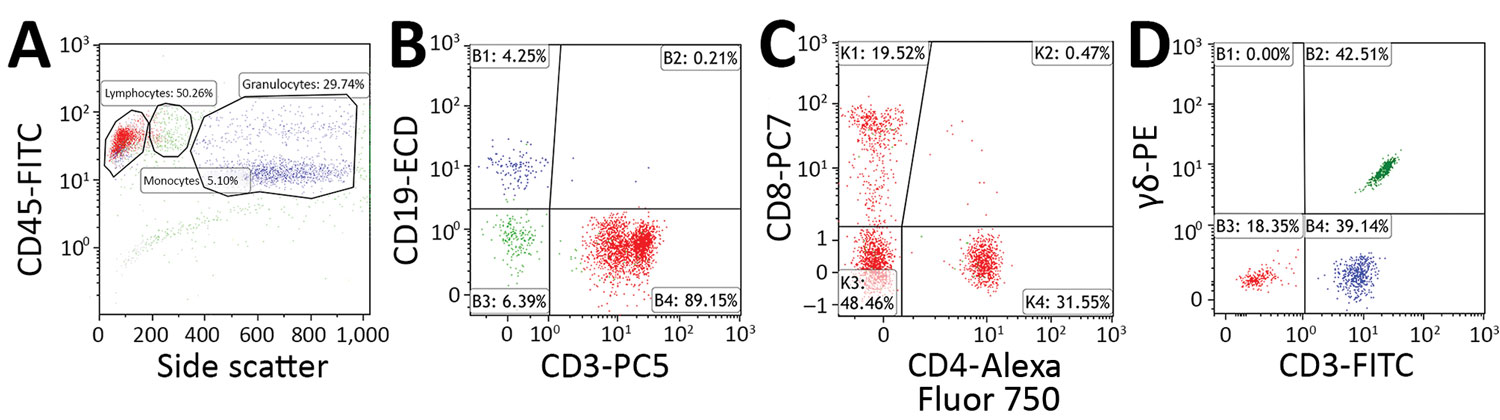
Figure 1. Flow cytometry gating strategy used to determine percentage of CD3+ lymphocytes that are CD3+/CD4–/CD8– T cells and γδ T cells in peripheral blood samples acquired from patients with suspected tularemia, Czech Republic, 2003–2015. A–C) Staining with CYTO-STAT tetraCHROME CD45-FITC/CD56-RD1 (phycoerythrin)/CD19-ECD/CD3-PC5, anti–CD4-Alexa Fluor 750, and anti–CD8-PC7 (Beckman Coulter, https://www.beckmancoulter.com). A) CD45 versus side scatter plot. Percentages of lymphocytes (red), monocytes (green), and granulocytes (blue) are indicated. In total, 3,000 lymphocytes were selected for further analysis. B) B cells (blue) and T cells (red) plotted according to their CD19 and CD3 expression. Percentages of cells within each quadrant are indicated. T cells were selected for further analysis. C) Percentage of CD3+ T cells not displaying CD4 and CD8 (CD4–/CD8–) determined with CD4 versus CD8 plots. Percentages of cells within each quadrant are indicated. D) Staining with anti–CD3-FITC and anti–T-cell receptor PAN γδ-PE (Beckman Coulter). After a side scatter and forward scatter plot (not shown), the percentage of lymphocytes that were CD3+/γδ T cells (green) were determined with a CD3 versus T-cell receptor pan–γδ plot. Percentages of cells within each quadrant are indicated. Flow cytometry was performed in the Immunology Laboratory of České Budějovice Hospital (České Budějovice, Czech Republic). ECD, phycoerythrin-Texas Red-X; FITC, fluorescein isothiocyanate; PC, phycoerythrin cyanine; PE, phycoerythrin.

Main Article

1Preliminary data from this study were presented at the European Congress of Clinical Microbiology and Infectious Diseases; April 9–12, 2016; Amsterdam, the Netherlands (abstract no. O367).

Page created: September 17, 2019
Page updated: September 17, 2019
Page reviewed: September 17, 2019
The conclusions, findings, and opinions expressed by authors contributing to this journal do not necessarily reflect the official position of the U.S. Department of Health and Human Services, the Public Health Service, the Centers for Disease Control and Prevention, or the authors' affiliated institutions. Use of trade names is for identification only and does not imply endorsement by any of the groups named above.
file_external