Early Diagnosis of Tularemia by Flow Cytometry, Czech Republic, 2003–20151
Aleš Chrdle

, Pavlína Tinavská, Olga Dvořáčková, Pavlína Filipová, Věra Hnetilová, Pavel Žampach, Květoslava Batistová, Václav Chmelík, Amanda E. Semper, and Nick J. Beeching
Author affiliations: České Budějovice Hospital, České Budějovice, Czech Republic (A. Chrdle, P. Tinavská, P. Filipová, V. Hnetilová, P. Žampach, V. Chmelík); University of South Bohemia Faculty of Health and Social Sciences, České Budějovice, Czech Republic (A. Chrdle, O. Dvořáčková); Royal Liverpool University Hospital, Liverpool, UK (A. Chrdle, N.J. Beeching); Písek Hospital, Písek, Czech Republic (K. Batistová); Public Health England, Porton Down, UK (A.E. Semper); National Institute for Health Research Health Protection Research Unit in Emerging and Zoonotic Infections, Liverpool, UK (A.E. Semper; N.J. Beeching); Liverpool School of Tropical Medicine, Liverpool (N.J. Beeching)
Main Article
Figure 4
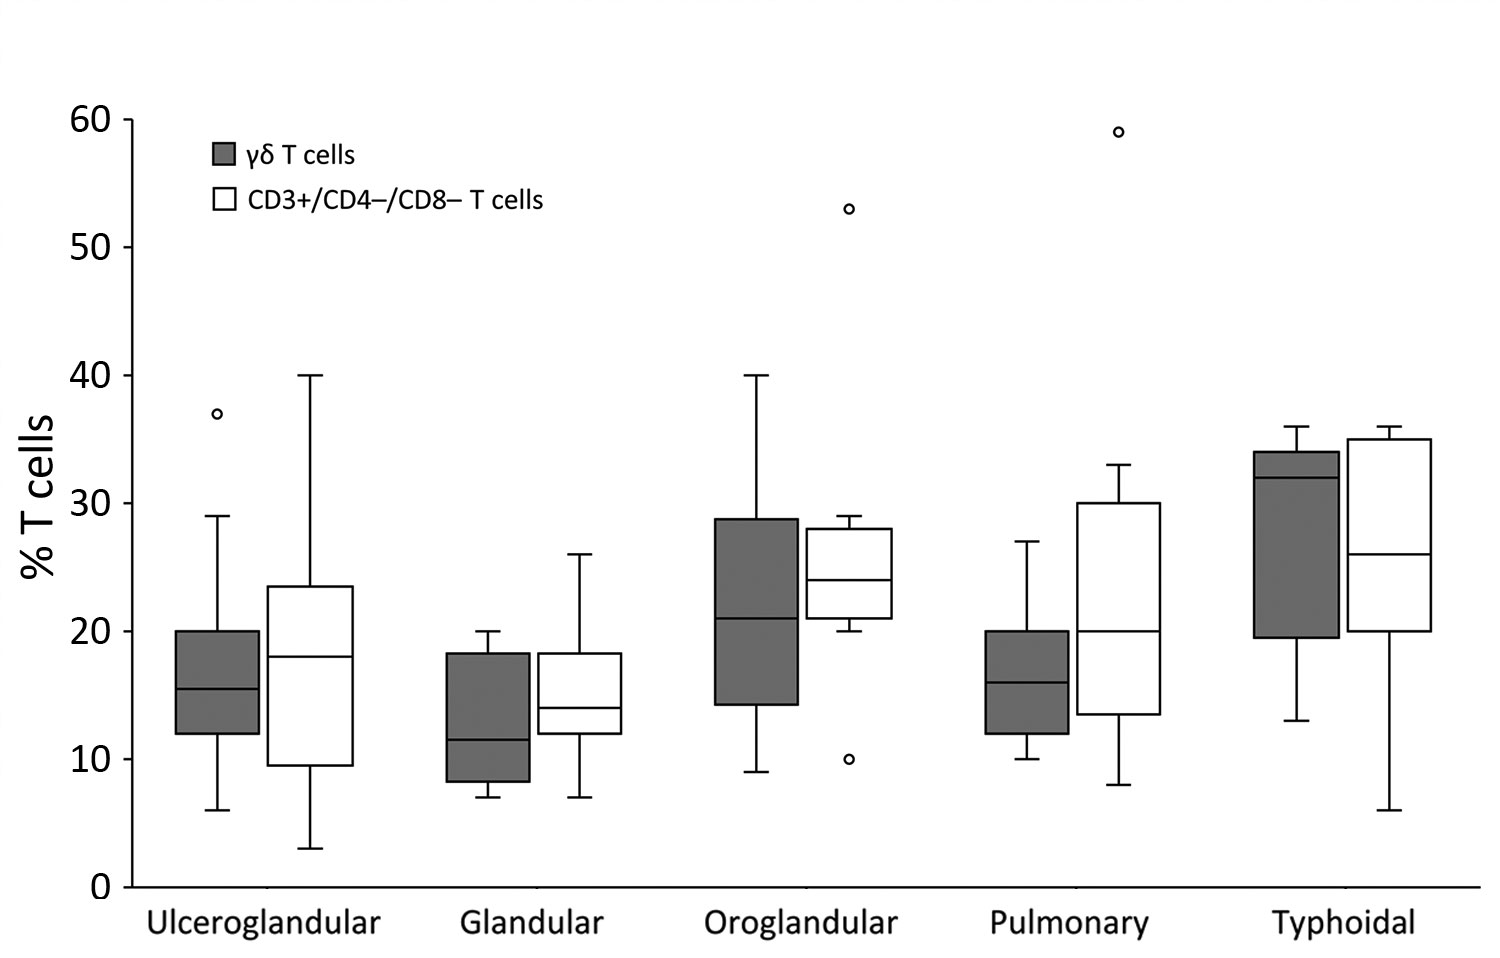
Figure 4. Percentage of CD3+ lymphocytes that are γδ T cells and CD3+/CD4–/CD8– T cells in peripheral blood samples from patients with confirmed or probable tularemia by clinical manifestation, Czech Republic, 2003–2015. The percentage of γδ T cells was determined for 48 cases and percentage of CD3+/CD4–/CD8– T cells for 64 cases. Paired comparisons (Kruskal-Wallis test) reveal no significant differences except for glandular versus typhoidal in γδ (p = 0.037) and CD3+/CD4–/CD8– T cells (p = 0.041). Boxes indicate interquartile ranges (IQRs), horizontal lines within boxes indicate medians, whiskers indicate range values <1.5× the IQR limits, and circles indicate outliers (i.e., values >1.5× the IQR limits).
Main Article
Page created: September 17, 2019
Page updated: September 17, 2019
Page reviewed: September 17, 2019
The conclusions, findings, and opinions expressed by authors contributing to this journal do not necessarily reflect the official position of the U.S. Department of Health and Human Services, the Public Health Service, the Centers for Disease Control and Prevention, or the authors' affiliated institutions. Use of trade names is for identification only and does not imply endorsement by any of the groups named above.