Delineating and Analyzing Locality-Level Determinants of Cholera, Haiti
Karolina Griffiths

, Kenny Moise, Martine Piarroux, Jean Gaudart, Samuel Beaulieu, Greg Bulit, Jean-Petit Marseille, Paul Menahel Jasmin, Paul Christian Namphy, Jean-Hugues Henrys, Renaud Piarroux, and Stanislas Rebaudet
Author affiliations: Aix Marseille University, Marseille, France (K. Griffiths, J. Gaudart, S. Rebaudet); Université Quisqueya, Port-au-Prince, Haiti (K. Moise, J.-H. Henrys); Centre d’épidémiologie et de santé Publique des armées, Marseille (M. Piarroux); UNICEF, Kinshasa, Democratic Republic of the Congo (S. Beaulieu); UNICEF, New York, New York, USA (G. Built); Direction Nationale de l’Eau Potable et de l’Assainissement, Hinche, Haiti (J.-P. Marseille); Ministère de la Santé Publique et de la Population, Hinche (P.M. Jasmin); Direction Nationale de l’Eau Potable et de l’Assainissement, Petion-Ville, Haiti (P.C. Namphy); Sorbonne Université, Paris, France (R. Piarroux)
Main Article
Figure 4
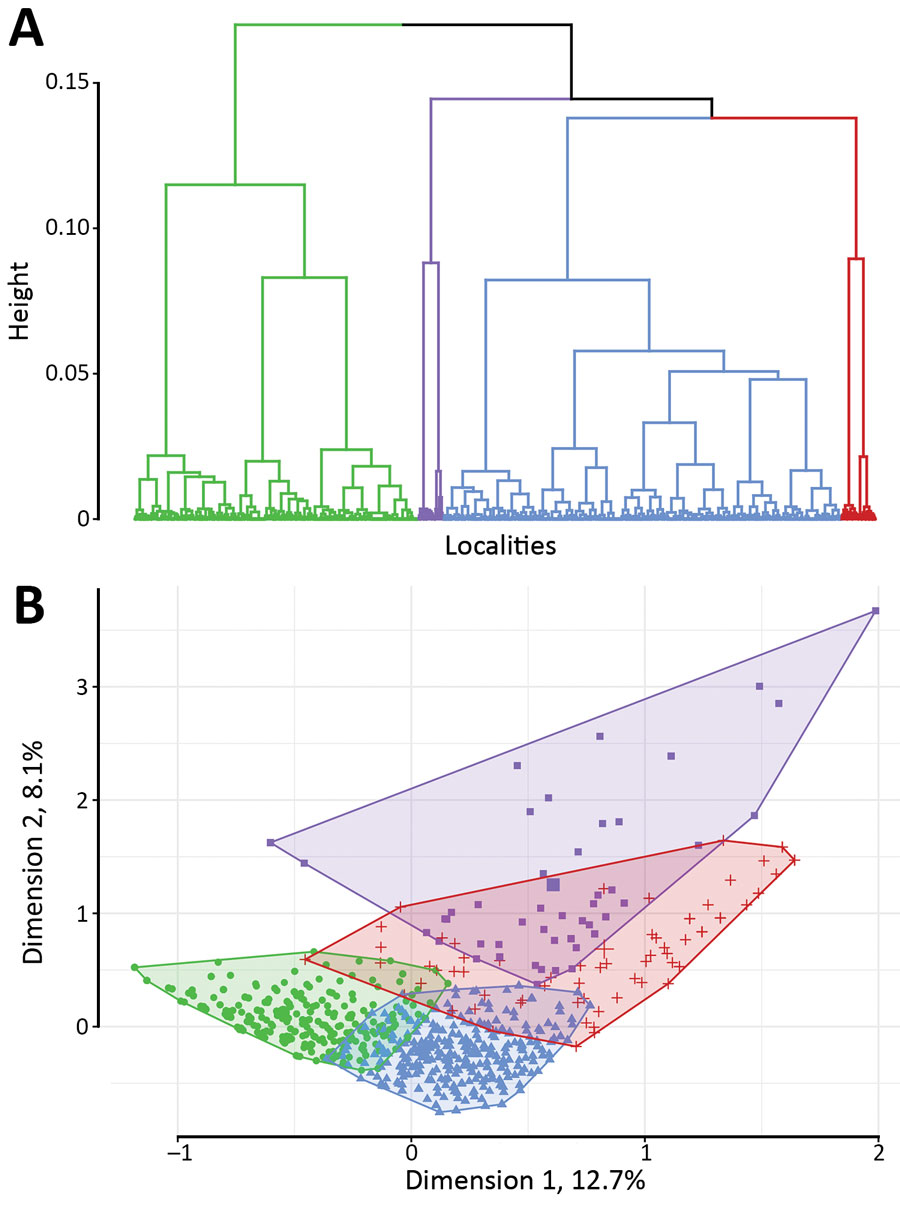
Figure 4. Classification analysis of localities regarding environmental variables based on hierarchical clustering on principal components of multiple correspondence analysis, Centre Department, Haiti. A) Cluster dendrogram demonstrating the division of localities into 4 classes: green, class 1; blue, class 2; purple, class 3; red, class 4. Height indicates the order at which the clusters were joined. B) Factor map demonstrating the 4 classes on the first 2 dimensions of the multiple correspondence analysis with the following variables: altitude, distance to an unimproved water source, distance to an improved water source, distance to road, distance to a river, presence of market, rural or urban, and cholera vaccination. The x and y axes represent the first 2 dimensions of the multiple correspondence analysis; the percentage of the total dataset inertia is represented by each dimension. Each point is a locality, with the shaded areas representing the 4 classes, as in panel A.
Main Article
Page created: November 23, 2020
Page updated: December 21, 2020
Page reviewed: December 21, 2020
The conclusions, findings, and opinions expressed by authors contributing to this journal do not necessarily reflect the official position of the U.S. Department of Health and Human Services, the Public Health Service, the Centers for Disease Control and Prevention, or the authors' affiliated institutions. Use of trade names is for identification only and does not imply endorsement by any of the groups named above.