Volume 27, Number 1—January 2021
Research
Attribution of Illnesses Transmitted by Food and Water to Comprehensive Transmission Pathways Using Structured Expert Judgment, United States
Abstract
Illnesses transmitted by food and water cause a major disease burden in the United States despite advancements in food safety, water treatment, and sanitation. We report estimates from a structured expert judgment study using 48 experts who applied Cooke’s classical model of the proportion of disease attributable to 5 major transmission pathways (foodborne, waterborne, person-to-person, animal contact, and environmental) and 6 subpathways (food handler–related, under foodborne; recreational, drinking, and nonrecreational/nondrinking, under waterborne; and presumed person-to-person-associated and presumed animal contact-associated, under environmental). Estimates for 33 pathogens were elicited, including bacteria such as Salmonella enterica, Campylobacter spp., Legionella spp., and Pseudomonas spp.; protozoa such as Acanthamoeba spp., Cyclospora cayetanensis, and Naegleria fowleri; and viruses such as norovirus, rotavirus, and hepatitis A virus. The results highlight the importance of multiple pathways in the transmission of the included pathogens and can be used to guide prioritization of public health interventions.
Illnesses transmitted commonly by food and water result in a major disease burden on both a national and a global scale (1). Each year in the United States, ≈9.4 million illnesses, 56,000 hospitalizations, and 1,351 deaths are caused by 31 known pathogens transmitted through food (2). Previous estimates of the burden of waterborne disease in the United States have largely focused on the burden of gastrointestinal illness associated with drinking water; an estimated 4–32 million cases of illness occur each year (3,4).
Source attribution is a process of estimating the proportion of illnesses resulting from various exposures for specific pathogens. Attributing illnesses to sources can guide decisions about where to target prevention and control efforts by apportioning illnesses to specific sources, thus aiding in the development of specific interventions (5). Attributing to the comprehensive set of transmission pathways considered in this study (foodborne, waterborne, person-to-person, animal contact, and environmental) is challenging for many reasons, including limited data and difficulty combining existing data from multiple sources. For example, outbreak surveillance data, such as those collected through the National Outbreak Reporting System (NORS), can provide information on sources of illness but are subject to reporting biases and may not be representative of endemic disease (6). Other studies have also raised concerns of publication bias toward novel, unique, or large foodborne outbreaks, limiting the utility of systematic reviews of published outbreaks in assessing source attribution (7,8). One method to address these barriers is structured expert judgment (SEJ), a method to use and combine estimates produced by experts and quantify uncertainty for the purpose of risk analysis when the ability to gather data is hindered by high expense, data scarcity, or lack of reliable data. This method, when executed well, is formal, reproducible, and mathematically and scientifically rigorous (9–11).
The Centers for Disease Control and Prevention (CDC) works to control and prevent illness caused by foodborne and waterborne pathogens in the United States. To accomplish this, CDC supports states and territories in tracking disease, detects and responds to outbreaks, and uses surveillance and sentinel site data to estimate the burden of these diseases in the United States. To inform this work, we implemented an SEJ study using Cooke’s classical model to estimate the proportion of domestically acquired illnesses for 33 pathogens transmitted through food and water that can be attributed to each of 5 major transmission pathways and 6 subpathways (12).
The process was divided into 3 stages: preparation, elicitation, and postelicitation (11). These stages are detailed in the following sections.
Preparation
Selection of Pathogens
We included all pathogens transmitted commonly through food or water that were examined by Scallan et al. (2) and Collier et al. (13) except those for which the only syndrome of interest was considered to have >95% foodborne transmission (e.g., Listeria monocytogenes, Clostridium botulinum); we added 3 free-living amoebae (2,13). For some pathogens, subdivisions into categories by serotype, patient age, or clinical manifestations of interest were included because transmission pathways were assumed to be different. For example, for Salmonella, the 5 most common serotypes were included along with 2 groups of rarer serotypes based on a ranking of their coefficients of variation (CVs) calculated from the patients’ ages, sexes, states of residence, and the year and month specimens were obtained (group 1, lowest CVs; group 2, highest CVs) as described by Boore et al. (14). This compilation resulted in a total of 33 pathogens and 47 target questions, or categories, for estimation. The 47 target questions were grouped into 15 panels on the basis of similarities between pathogen microbiology and ecology (Table 1).
Transmission Pathway Definitions
We used definitions for 5 major pathways that were mutually exclusive and comprehensive (i.e., covering 100% of transmission modes) and that reflect those used by CDC for outbreak surveillance (15,16; Tables 2, 3). We defined 3 mutually exclusive waterborne subpathways (recreational water, drinking water, and nonrecreational nondrinking water) that were comprehensive (i.e., all waterborne pathway transmission fell into 1 of the 3 subpathways). We also defined and elicited 1 foodborne (food handler-related) and 2 environmental (presumed animal associated, presumed person-to-person) subpathways that accounted for only a portion of transmission within their main pathway. We calculated the unelicited proportion remaining of their respective main pathways during analysis and assigned it to the subpathways other foodborne and other environmental. For all transmission pathways, we defined the point of attribution as the point of exposure (i.e., the event during which a person ingested, or was otherwise exposed to, the pathogen).
Expert Identification and Selection
Figure 1
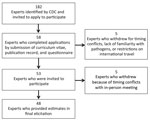
Figure 1. Expert selection process for study of attribution of illnesses transmitted by food and water to comprehensive transmission pathways using structured expert judgment, United States, 2017.
We identified 182 experts representing a range of scientific backgrounds (e.g., epidemiologists, laboratory scientists, and environmental engineers from government, academia, nongovernmental organizations, and industry) on the basis of publication records, experience, expertise, or previous participation in source attribution studies. We contacted the experts directly and invited them to apply for participation (Figure 1). Fifty-eight returned a curriculum vitae and publication record and completed a questionnaire about their professional interest, knowledge, and experience for each of the 33 pathogens using a 4-level Likert scale (high, medium, low, or none) by the requested deadline. We asked experts to suggest additional experts to be considered; the 3 who were suggested were also invited.
Assignment to Panels
We evaluated expert applications based on area of expertise, education, work history, professional interest, experience, and knowledge of the individual pathogens in this study. Publication record was not used to determine eligibility because it could have led to elimination of qualified experts who do not publish frequently. We used maximum bipartite matching in R version 3.3.1 with the igraph package version 1.0.1 to assign experts to panels based on their curricula vitae, publication records, and questionnaire responses (17,18). Final assignment ensured that experts were not on pathogen panels for which they reported none or low experience. Individual experts were on panels for <15 pathogens (Appendix 1).
Calibration Questions
The study administrators used unpublished data to develop calibration questions (Appendix 2). We developed 14 questions to evaluate the experts’ statistical accuracy and informativeness by probing the experts’ ability to provide reliable estimates under uncertainty. The subject domain of the questions aimed to represent expertise in public health surveillance of foodborne and waterborne diseases, food consumption patterns in the United States, and human exposure and occurrence data about pathogens in food, water, and the environment.
Target Questions
Target questions asked the proportion of illnesses transmitted through the 5 major pathways and 6 subpathways for all study pathogens. Study administrators blocked transmission pathways and subpathways for some pathogens based on their microbiology and ecology (Table 4). We created individualized Microsoft Excel version 14.7.7 (http://www.microsoft.com) files with separate sheets for calibration questions, target questions for each assigned pathogen, and additional instructions for each expert. We included verification aids in the worksheets to assist the experts (Appendix 3).
Dry Run Exercise
We conducted a dry run exercise using video web conferencing to assess calibration questions, target question answer sheets, and expert training materials for completeness, clarity, and ease of use. Six persons from academia, state health departments, and CDC participated in this trial exercise, but not in the formal elicitation itself. We modified the elicitation materials based on feedback from this exercise.
Expert Orientation
Before the formal elicitation, experts attended a training webinar to learn definitions of transmission pathways, subpathways, and point of attribution. To ensure common understanding of the definitions, experts completed a 20-question review of knowledge after the webinar (Appendix 4).
We provided a background document summarizing current surveillance data, when available, and relevant research findings for each pathogen. The document contained links to selected research articles. Experts were encouraged to use any data they felt were informative to make their estimates; they were not limited to only this document.
Elicitation
For the formal elicitation, 48 experts representing a wide range of professional and scientific backgrounds participated at a 2-day, in-person workshop in May 2017. During the workshop, experts participated in a 2-hour information session on probabilistic methods and providing estimates under uncertainty.
Calibration Questions
Experts were not expected to know true values precisely and provided low (5th percentile), median (50th percentile), and high (95th percentile) estimates to represent their uncertainty on the answers provided to the calibration questions. Experts were not allowed access to any additional resources while answering the calibration questions and, after they had they had finished, they could not return to this section to change their responses.
Target Questions
After completion of the calibration questions, experts provided 5th, 50th, and 95th percentile estimates for the proportion of domestically acquired illnesses that are transmitted through each major pathway and subpathway annually for each pathogen and target question in each panel to which they were assigned. The experts were also asked to indicate if they did not agree with the pathways blocked by study administrators. One pathway, person-to-person transmission for Legionella spp., was unblocked based on this feedback, and experts provided this estimate with the others at the in-person elicitation. Experts could access resources and discuss them with colleagues, if desired. However, we emphasized that the final estimates should represent the expert’s individual responses, not a group consensus.
Postelicitation
Re-Elicitation
After the in-person elicitation was completed, we determined that re-elicitation for some pathogens was necessary. More granular detail was needed beyond the single estimate for Pseudomonas, so estimates were re-elicited for otitis externa, septicemia, and pneumonia. Based on feedback we received during the elicitation, we re-elicited estimates for non–acute gastrointestinal infections (non-AGI) for nontoxigenic Vibrio cholerae, V. parahaemolyticus, V. vulnificus, and V. alginolyticus. Experts were provided with feedback with updated surveillance data and given the opportunity to adjust their original estimates if new data led them to reconsider their previous estimates (Figure 1). The re-elicitations were completed through follow-up emails and web conferences.
Data Analysis
We analyzed data using EXCALIBUR (19). We combined all individual expert assessments by linear pooling into a single uncertainty assessment for each target question (11). For equal-based weighting, all experts’ assessments contributed to the combined uncertainty assessment evenly. We computed performance-based weighting by combining the statistical accuracy and information scores of experts in each panel. The weighted combination of experts is referred to as the decision maker. We used the item weight decision maker because this calculates and applies weights per individual target question rather than for all questions an expert answered. We performed optimization to determine the threshold by which an expert’s responses would be included in the final estimate or not. This was done separately per expert for each panel, based on each expert’s statistical accuracy score (12).
We performed a subgroup analysis to determine whether separate schools of thought existed as a result of experts’ self-identified background (categorized as mainly foodborne, mainly waterborne, or both). This analysis was completed by 2 independent reviewers who analyzed EXCALIBUR panel outputs for each target question to determine whether wide divergence existed among individual responses.
We normalized random samples from the weighted distributions for major transmission pathways and waterborne subpathways such that on each sample the values across pathways summed to 1. This process was done by resampling the cumulative distribution functions generated by EXCALIBUR 5,000 times in R version 3.4.3 for each pathogen, while dividing all sampled values by the sum of their values per iteration. Point estimates and 95% uncertainty intervals (UIs) for each target question and pathway were produced. We performed robustness analysis and out-of-sample validation to assess the performance of the method and to evaluate the effect of individual experts and individual calibration questions on the final distribution (Appendix 5) (12).
Knowledge Review
The 20 questions were designed to be challenging, to emphasize application of the study definitions, and to represent scenarios at the boundaries among different transmission pathways. For 17 (85%) questions, >75% of participants answered with the correct major pathway, and of these questions, 13 (76%) were answered with the correct subpathway as well (Appendix 4).
Major and Subpathway Results
Figure 2
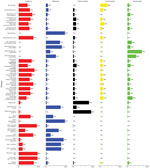
Figure 2. Source attribution results for major transmission pathways of bacteria in study of attribution of illnesses transmitted by food and water to comprehensive transmission pathways using structured expert judgment, United States,...
Figure 3
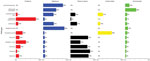
Figure 3. Source attribution results for major transmission pathways of protozoa and viruses for study of attribution of illnesses transmitted by food and water to comprehensive transmission pathways using structured expert judgment,...
Table 4 and Figures 2 and 3 show the proportion and UI of domestically acquired illnesses attributed to the 5 major transmission pathways; Tables 5 and 6 show the subpathway results. For all panels, a satisfactory number of accurate and informative experts were included. Differing schools of thought based on experts’ backgrounds were not identified (Appendix 5).
Bacteria
Most of the pathogens in this study were bacteria; they encompassed 35 of the 47 target questions. More than half of transmission (>50%) was attributed to the foodborne pathway for Campylobacter spp.; enterotoxigenic Escherichia coli; Shiga toxin-producing Escherichia coli (STEC) O157; other diarrheagenic E. coli; Mycobacterium bovis; nontyphoidal Salmonella enterica (all ages and serotypes); S. enterica serotypes Enteritidis, I 4,[5],12:i:-, Javiana, Newport, Typhimurium, and group 1 serotypes; Vibrio alginolyticus; V. cholerae nontoxigenic; V. parahaemolyticus; Vibrio spp., other AGI; Vibrio spp, other non-AGI; and Yersinia enterocolitica. In addition, Legionella spp.; nontuberculous Mycobacterium spp.; Pseudomonas spp., otitis externa; invasive Staphylococcus aureus; V. alginolyticus, non-AGI; V. cholerae nontoxigenic, non-AGI; V. parahaemolyticus, non-AGI; and V. vulnificus were all estimated to have majority transmission from the waterborne pathway. Most transmission for Shigella spp. and group A Streptococcus were estimated to be through person-to-person transmission. No bacterial pathogen had majority transmission through animal contact. Pseudomonas spp. septicemia was attributed primarily to the environmental pathway.
Protozoa
Cyclospora cayetanensis was the only protozoan estimated to have majority transmission through the foodborne pathway. Acanthamoeba spp. and Naegleria fowleri both had >80% transmission attributed to the waterborne pathway, and 54% (UI 5%–95%) of Balamuthia mandrillaris infections were estimated to occur through waterborne transmission. No protozoa had majority person-to-person or environmental transmission. Waterborne transmission was estimated at 43% (UI 17%–73%) for Cryptosporidium spp. and 44% (UI 16%–78%) for Giardia spp. Among all pathogens, Toxoplasma gondii had the highest attribution to animal contact transmission, 58% (UI 24%–86%).
Viruses
Most transmission for astrovirus, norovirus, rotavirus, and sapovirus was attributed to the person-to-person pathway. Hepatitis A virus was estimated to have the highest proportion of illness transmitted by the foodborne pathway at 42% (UI 9%–78%). Of this, 48% (UI 2%–93%) was considered food handler related. Of foodborne transmission, 50%–71% was estimated to be food handler related for astrovirus, norovirus, and sapovirus. For all viruses, 67%–88% of environmental transmission was attributed to the subpathway of presumed person-to-person transmission.
This study presents a novel method for estimating the proportion of illnesses from pathogens transmitted commonly by food and water in the United States through comprehensive and mutually exclusive pathways. It includes estimates for food handler–related, recreational water, drinking water, nonrecreational nondrinking water, and various environmental subpathways. This method enabled estimates to be informed by multiple data sources, including outbreak surveillance data, studies of sporadic illnesses, case reports, and experts’ professional knowledge. The use of calibration to weight expert responses is a distinguishing characteristic of the classical model and introduces mathematical rigor not found with other elicitation methods.
Similar SEJ studies have been conducted in numerous countries, including Australia, Canada, and the Netherlands, as well as for global subregions, by the World Health Organization. Each of these used different transmission pathway definitions, study designs, and elicitation methods (20–23). This and other variations in methods limit comparison of estimates across studies, but provide support for some of the differences between our study results and previous US pathway attribution estimates. Previous estimates of foodborne transmission for 33 pathogens and animal contact transmission for 6 pathogens included in our study are available (2,24). We compared published foodborne and waterborne attribution studies with this study (Tables 7, 8).
Differences from previously published work on foodborne transmission attribution proportions were noted, including for Campylobacter spp., STEC non-O157, other diarrheagenic E. coli, nontyphoidal S. enterica, M. bovis, Shigella spp., Y. enterocolitica, C. cayetanensis, T. gondii, astrovirus, rotavirus, sapovirus, and hepatitis A virus. These differences could be the result of changes in data availability or analytic methods. For example, previous US foodborne illness estimates used data from surveillance, risk factor studies, and literature review (2). Based on available data for S. enterica (a case-control study of sporadic illness and unpublished outbreak data [2,25]), a study used an estimate of 94% foodborne transmission, notably higher than this study’s estimate of 66% (UI 48%–81%). Estimates more similar to the current study were reported in SEJ studies in the Netherlands (55%), Canada (63%), and Australia (71%) (21,22); these studies examined attribution to similar major pathways to those included in this study versus foodborne transmission only. Our estimates of foodborne transmission of astrovirus (15%), rotavirus (5%), and sapovirus (13%) are much higher than the estimate of <1% for each in an earlier study (2); reports of foodborne outbreaks caused by these viruses in CDC’s outbreak surveillance systems informed our estimates. Reporting of enteric disease outbreaks transmitted by nonfoodborne routes has improved, and experts probably used these new data to inform their estimates (26).
This study provides noteworthy estimates for the food handler–related subpathway. For hepatitis A, both the World Health Organization and this study estimate 42% foodborne transmission, of which this study estimated 48% (UI 2%–93%) to be food handler-related (20). However, this study was conducted before widespread awareness of a massive increase in person-to-person transmission in the United States (27). Previous estimates of foodborne transmission were 11% in the Netherlands and 7% in the United States (2,21). The use of different pathway definitions, points of attribution, and inclusion of travel-related illness in these other studies might have contributed to these differences (21,28). For norovirus, 71% (UI 29%–99%) of foodborne transmission in our study was attributed to the food handler subpathway, which is supported by studies of outbreaks in the United States (29,30).
For the waterborne transmission pathway, attribution in the context of the other pathways has not been done before in the United States. Furthermore, these estimates include subpathway estimates and non-gastroenteritis clinical outcomes. For bacterial pathogens, the estimates suggest that the proportion of illnesses linked to water is higher than previously appreciated. The estimates for waterborne bacterial pathogens were associated with high rates of illness and death, including nontuberculous Mycobacterium spp., Pseudomonas spp., and Legionella spp. Of note, neither Giardia spp. nor Cryptosporidium spp., parasites traditionally understood to be waterborne, were assessed as predominantly waterborne; instead, person-to-person and animal contact, particularly for Cryptosporidium, were key pathways. For the free-living amebae Acanthamoeba spp., B. mandrillaris, and N. fowleri, limited data are available on exact exposures associated with these rare illnesses (31,32). The proportion of viral pathogens transmitted by water was estimated to be relatively low (6%–8%), although for norovirus this represents a substantial proportion of estimated annual waterborne disease illnesses (32). This study also provides estimates for 3 waterborne disease subpathways. Of note is the proportion of otitis externa infections caused by Pseudomonas spp. that were attributed to recreational water exposure, and the combined contribution of drinking and nonrecreational, nondrinking water exposures to nongastroenteritis outcomes of Pseudomonas spp. (excluding otitis externa), nontuberculous Mycobacterium spp., and Legionella spp. CDC has used results from this SEJ to help estimate that 7.2 million waterborne illnesses occur from 17 pathogens annually, including 600,000 emergency department visits, 120,000 hospitalizations, and 7,000 deaths, incurring $3.2 billion (2014 US dollars) in direct healthcare costs (33).
Whereas the primary focus of this SEJ study was illnesses transmitted commonly by food and water, including person-to-person, animal contact, and environmental transmission was integral to the study and led to notable findings. For example, this study estimated animal contact transmission of STEC O157 at 12% (UI 3%–25%) and of STEC non-O157 at 21% (UI 2%–46%). Previous US animal contact estimates, which were based on a FoodNet case-control study and outbreak surveillance data, estimated STEC O157 at 6% and STEC non-O157 at 8% (24). This discrepancy may be the result of differences in pathway definitions and the inclusion of additional data.
As with other SEJ studies, this study is subject to limitations that can affect the interpretation of results. Estimates for many pathogens had wide UIs, highlighting areas in which data gaps remain and further investment into public health surveillance and research may be warranted. More detailed attribution, such as by food category, was beyond the scope of this study. This study considered attribution at a national level and does not represent the geographic variability that exists for some pathogens. Experts provided estimates considering data available during the elicitation session, but infectious disease epidemiology can change rapidly, so these results may not reflect current transmission patterns. New information should be considered when applying these estimates (e.g., for disease burden calculations). Expert fatigue may have been a factor for participants who were asked to provide estimates for a large number of pathogens. For intervention and policy-making purposes, these results should be considered in context with results from other data-driven approaches, such as those done by the Interagency Food Safety Analytics Collaboration and for the Model Aquatic Health Code (34,35).
In conclusion, our findings provide a balanced understanding of multiple routes of transmission for 33 pathogens. This information can be used to support appropriate targeting of resources to prevent infections transmitted by all pathways and to invest in research and surveillance.
Dr. Beshearse is an Epidemic Intelligence Service officer in the National Center for Emerging and Zoonotic Infectious Diseases at the Centers for Disease Control and Prevention, Atlanta, Georgia, USA. Her primary research interests include public health and foodborne and waterborne diseases.
Acknowledgment
We thank all those who contributed their expertise and time to this study, especially our expert participants, dry run participants, subject matter experts at CDC, and other CDC and University of Florida staff who assisted.
References
- Havelaar AH, Kirk MD, Torgerson PR, Gibb HJ, Hald T, Lake RJ, et al.; World Health Organization Foodborne Disease Burden Epidemiology Reference Group. World Health Organization global estimates and regional comparisons of the burden of foodborne disease in 2010. PLoS Med. 2015;12:
e1001923 .DOIPubMedGoogle Scholar - Scallan E, Hoekstra RM, Angulo FJ, Tauxe RV, Widdowson MA, Roy SL, et al. Foodborne illness acquired in the United States—major pathogens. Emerg Infect Dis. 2011;17:7–15.DOIPubMedGoogle Scholar
- Colford JM Jr, Roy S, Beach MJ, Hightower A, Shaw SE, Wade TJ. A review of household drinking water intervention trials and an approach to the estimation of endemic waterborne gastroenteritis in the United States. J Water Health. 2006;4(Suppl 2):71–88.DOIPubMedGoogle Scholar
- Messner M, Shaw S, Regli S, Rotert K, Blank V, Soller J. An approach for developing a national estimate of waterborne disease due to drinking water and a national estimate model application. J Water Health. 2006;4(Suppl 2):201–40.DOIPubMedGoogle Scholar
- Painter JA, Hoekstra RM, Ayers T, Tauxe RV, Braden CR, Angulo FJ, et al. Attribution of foodborne illnesses, hospitalizations, and deaths to food commodities by using outbreak data, United States, 1998-2008. Emerg Infect Dis. 2013;19:407–15.DOIPubMedGoogle Scholar
- Hall AJ, Wikswo ME, Manikonda K, Roberts VA, Yoder JS, Gould LH. Acute gastroenteritis surveillance through the National Outbreak Reporting System, United States. Emerg Infect Dis. 2013;19:1305–9.DOIPubMedGoogle Scholar
- O’Brien SJ, Gillespie IA, Sivanesan MA, Elson R, Hughes C, Adak GK. Publication bias in foodborne outbreaks of infectious intestinal disease and its implications for evidence-based food policy. England and Wales 1992-2003. Epidemiol Infect. 2006;134:667–74.DOIPubMedGoogle Scholar
- Verhoef L, Hewitt J, Barclay L, Ahmed SM, Lake R, Hall AJ, et al. Norovirus genotype profiles associated with foodborne transmission, 1999-2012. Emerg Infect Dis. 2015;21:592–9.DOIPubMedGoogle Scholar
- Hoffmann S, Fischbeck P, Krupnick A, McWilliams M. Informing risk-mitigation priorities using uncertainty measures derived from heterogeneous expert panels: a demonstration using foodborne pathogens. Reliab Eng Syst Saf. 2008;93:687–98. DOIGoogle Scholar
- Colson AR, Cooke RM. Expert elicitation: using the classical model to validate experts’ judgments. Rev Environ Econ Policy. 2018;12:113–32.
- Cooke RM, Goossens LHJ. Procedures guide for structured expert judgment. Delft (the Netherlands): Delft University of Technology; 1999.
- Cooke RM. Experts in uncertainty: opinion and subjective probability in science. New York: Oxford University Press; 1991.
- Collier SA, Stockman LJ, Hicks LA, Garrison LE, Zhou FJ, Beach MJ. Direct healthcare costs of selected diseases primarily or partially transmitted by water. Epidemiol Infect. 2012;140:2003–13.DOIPubMedGoogle Scholar
- Boore AL, Hoekstra RM, Iwamoto M, Fields PI, Bishop RD, Swerdlow DL. Salmonella enterica infections in the United States and assessment of coefficients of variation: a novel approach to identify epidemiologic characteristics of individual serotypes, 1996–2011. PLoS One. 2015;10:
e0145416 .DOIPubMedGoogle Scholar - Centers for Disease Control and Prevention. National Outbreak Reporting System (NORS) user guidance—waterborne disease outbreaks. 2017 [cited 2019 Jan 18]. https://www.cdc.gov/nors/pdf/CDC_5212_guidance.pdf
- Centers for Disease Control and Prevention. National Outbreak Reporting System (NORS) guidance. 2017 [cited 2019 Jan 18]. https://www.cdc.gov/nors/downloads/guidance.pdf
- Sedgewick R, Wayne K. Algorithms, 4th ed. Upper Saddle River (NJ): Addison-Wesley; 2011.
- R Core Team. R: a language and environment for statistical computing. Vienna: R Foundation for Statistical Computing; 2017.
- EXCALIBUR [computer software]. Version 1.0. Delft (the Netherlands): TU Delft; 1989.
- Hald T, Aspinall W, Devleesschauwer B, Cooke R, Corrigan T, Havelaar AH, et al. World Health Organization estimates of the relative contributions of food to the burden of disease due to selected foodborne hazards: a structured expert elicitation. PLoS One. 2016;11:
e0145839 .DOIPubMedGoogle Scholar - Havelaar AH, Galindo AV, Kurowicka D, Cooke RM. Attribution of foodborne pathogens using structured expert elicitation. Foodborne Pathog Dis. 2008;5:649–59.DOIPubMedGoogle Scholar
- Butler AJ, Thomas MK, Pintar KD. Expert elicitation as a means to attribute 28 enteric pathogens to foodborne, waterborne, animal contact, and person-to-person transmission routes in Canada. Foodborne Pathog Dis. 2015;12:335–44.DOIPubMedGoogle Scholar
- Vally H, Glass K, Ford L, Hall G, Kirk MD, Shadbolt C, et al. Proportion of illness acquired by foodborne transmission for nine enteric pathogens in Australia: an expert elicitation. Foodborne Pathog Dis. 2014;11:727–33.DOIPubMedGoogle Scholar
- Hale CR, Scallan E, Cronquist AB, Dunn J, Smith K, Robinson T, et al. Estimates of enteric illness attributable to contact with animals and their environments in the United States. Clin Infect Dis. 2012;54(Suppl 5):S472–9.DOIPubMedGoogle Scholar
- Mermin J, Hutwagner L, Vugia D, Shallow S, Daily P, Bender J, et al.; Emerging Infections Program FoodNet Working Group. Reptiles, amphibians, and human Salmonella infection: a population-based, case-control study. Clin Infect Dis. 2004;38(Suppl 3):S253–61.DOIPubMedGoogle Scholar
- Centers for Disease Control and Prevention. National Outbreak Reporting System (NORS) [cited 2019 Jan 18]. https://www.cdc.gov/nors/about.html
- Foster MA, Hofmeister MG, Kupronis BA, Lin Y, Xia GL, Yin S, et al. Increase in hepatitis A virus infections—United States, 2013–2018. MMWR Morb Mortal Wkly Rep. 2019;68:413–5.DOIPubMedGoogle Scholar
- Centers for Disease Control and Prevention. Surveillance for viral hepatitis—United States, 2015 [cited 2019 Oct 15]. https://www.cdc.gov/hepatitis/statistics/2015surveillance/index.htm
- Hall AJ, Wikswo ME, Pringle K, Gould LH, Parashar UD; Division of Viral Diseases, National Center for Immunization and Respiratory Diseases, CDC. Vital signs: foodborne norovirus outbreaks - United States, 2009-2012. MMWR Morb Mortal Wkly Rep. 2014;63:491–5.PubMedGoogle Scholar
- Hall AJ, Eisenbart VG, Etingüe AL, Gould LH, Lopman BA, Parashar UD. Epidemiology of foodborne norovirus outbreaks, United States, 2001-2008. Emerg Infect Dis. 2012;18:1566–73.DOIPubMedGoogle Scholar
- Centers for Disease Control and Prevention (CDC). Balamuthia amebic encephalitis—California, 1999-2007. MMWR Morb Mortal Wkly Rep. 2008;57:768–71.PubMedGoogle Scholar
- Cope JR, Murphy J, Kahler A, Gorbett DG, Ali I, Taylor B, et al. Primary amebic meningoencephalitis associated with rafting on an artificial whitewater river: case report and environmental investigation. Clin Infect Dis. 2018;66:548–53.DOIPubMedGoogle Scholar
- Collier SA, Deng L, Adam EA, Benedict KM, Beshearse EM, Blackstock A, et al. Estimate of burden and direct healthcare cost of infectious waterborne disease in the United States. Emerg Infect Dis. 2020 Dec 22 [Epub ahead of print].
- Blake R, Peters J. Model Aquatic Health Code (MAHC) and International Swimming Pool and Spa Code (ISPSC). J Environ Health. 2012;74:36–9.PubMedGoogle Scholar
- Centers for Disease Control and Prevention. Model Aquatic Health Code; 2018 [cited 2019 Feb 13]. https://www.cdc.gov/mahc/index.html
Figures
Tables
Cite This ArticleOriginal Publication Date: December 17, 2020
Table of Contents – Volume 27, Number 1—January 2021
| EID Search Options |
|---|
|
|
|
|
|
|
Please use the form below to submit correspondence to the authors or contact them at the following address:
Elizabeth Beshearse, Centers for Disease Control and Prevention, 1600 Clifton Rd, Mailstop H16-3, Atlanta, GA 30329-4027, USA
Top