Skip directly to site content Skip directly to page options Skip directly to A-Z link Skip directly to A-Z link Skip directly to A-Z link
Volume 28, Number 3—March 2022
CME ACTIVITY - Research

Neutralizing Enterovirus D68 Antibodies in Children after 2014 Outbreak, Kansas City, Missouri, USA

Robyn A. Livingston1, Christopher J. Harrison1Comments to Author , and Rangaraj Selvarangan1
Author affiliation: Children’s Mercy Hospital Kansas City, Kansas City, Missouri, USA; University of Missouri, Kansas City

Main Article

Figure

Reverse cumulative distribution (RCD) curves of enterovirus D68 (EV-D68) representing the distribution of neutralizing antibody titers against 3 EV-D68 viruses (clades B1, B2, and D) in serum samples obtained in 2017 from children <18 years of age in Kansas City, Missouri, USA, by patient age group. A) 6–35 months of age; B) 36–71 months of age; C) 72 months–10 years of age; D) 11–15 years of age; E) 16–18 years of age. A titer >3.0 log2 was considered positive for neutralizing antibodies. RCDs are curves for which each data point is the proportion of the population with a titer at least as high as the value on the x-axis. The calculated values for each area under curve (AUC) enable comparison of overall immune responses among age groups. Each panel shows 3 RCDs (1 for each virus). Panel A shows that the widest divergence of curves occurred among patients 6–35 months of age, who were born after the 2014 outbreak, suggesting less cross-neutralization among the 3 related viruses in this age group. RCDs become more convergent with each increasing age group. The largest AUCs in each age group are for the B1 predominant 2014 outbreak virus.

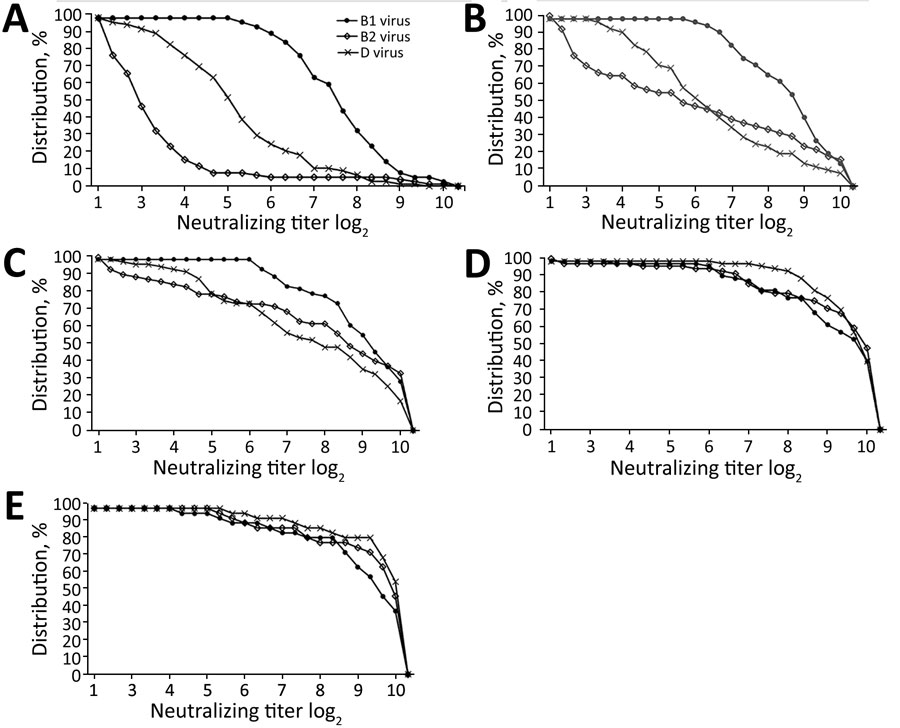
Figure. Reverse cumulative distribution (RCD) curves of enterovirus D68 (EV-D68) representing the distribution of neutralizing antibody titers against 3 EV-D68 viruses (clades B1, B2, and D) in serum samples obtained in 2017 from children <18 years of age in Kansas City, Missouri, USA, by patient age group. A) 6–35 months of age; B) 36–71 months of age; C) 72 months–10 years of age; D) 11–15 years of age; E) 16–18 years of age. A titer >3.0 log2 was considered positive for neutralizing antibodies. RCDs are curves for which each data point is the proportion of the population with a titer at least as high as the value on the x-axis. The calculated values for each area under curve (AUC) enable comparison of overall immune responses among age groups. Each panel shows 3 RCDs (1 for each virus). Panel A shows that the widest divergence of curves occurred among patients 6–35 months of age, who were born after the 2014 outbreak, suggesting less cross-neutralization among the 3 related viruses in this age group. RCDs become more convergent with each increasing age group. The largest AUCs in each age group are for the B1 predominant 2014 outbreak virus.

Main Article

1All authors contributed equally to this article.

Page created: January 03, 2022
Page updated: February 18, 2022
Page reviewed: February 18, 2022
The conclusions, findings, and opinions expressed by authors contributing to this journal do not necessarily reflect the official position of the U.S. Department of Health and Human Services, the Public Health Service, the Centers for Disease Control and Prevention, or the authors' affiliated institutions. Use of trade names is for identification only and does not imply endorsement by any of the groups named above.
file_external