Skip directly to site content Skip directly to page options Skip directly to A-Z link Skip directly to A-Z link Skip directly to A-Z link
Volume 29, Number 10—October 2023
Dispatch

Human-to-Human Transmission of Andes Virus Modeled in Syrian Hamsters

Silke A. Riesle-Sbarbaro, Norman Kirchoff, Katharina Hansen-Kant, Alice Stern, Andreas Kurth, and Joseph B. PrescottComments to Author 
Author affiliation: Robert Koch Institute, Berlin, Germany

Main Article

Figure 2

Timeline of Andes virus (ANDV) shedding and transmission between inoculated and naive Syrian hamster pairs from each cage. Panels A–F show data for cages 1–6. Left column displays shedding of ANDV RNA loads per rectal mucosa swab sample. Shedding loads of individual animals are shown as color-coded lines. Vertical shades show routine (yellow) or extra (grey) cage changes. Middle column displays tissue distribution of ANDV RNA per gram of tissue or milliliter of blood. The dashed horizontal grey line shows the inoculum dose. Right column displays results of nucleocapsid ELISA of serum collected at euthanasia. Antinucleocapsid serum titers are noted for animals that seroconverted. The assay cutoff is shown as a black curve with vertical line-ranges (mean +3 SD) of each serum dilution. To improve figure visualization, the y-axes in panels A–C were log10-transformed. Bla, bladder; Bld, blood; cLN, cervical lymph node; Hrt, heart; ID, identification; Li, liver; Lu, lung; OD405, Optical density at 405 nm; Rec, rectum; RSD, reciprocal serum dilutions; Sp, spleen.

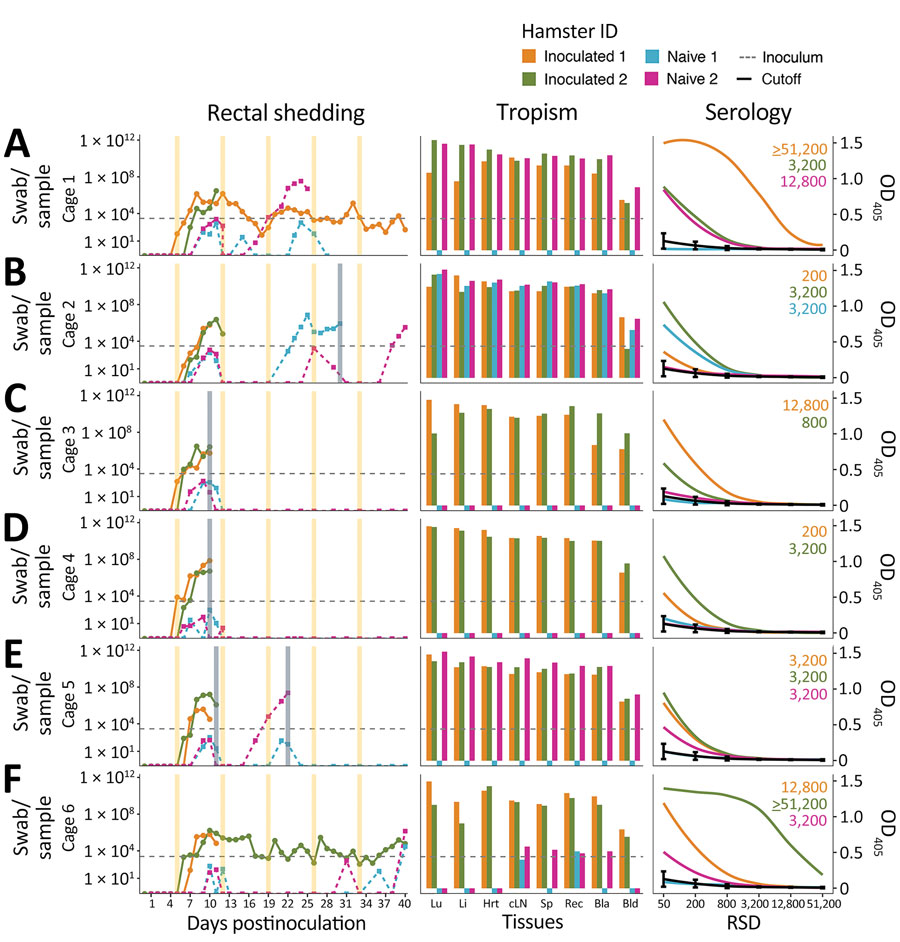
Figure 2. Timeline of Andes virus (ANDV) shedding and transmission between inoculated and naive Syrian hamster pairs from each cage. Panels A–F show data for cages 1–6. Left column displays shedding of ANDV RNA loads per rectal mucosa swab sample. Shedding loads of individual animals are shown as color-coded lines. Vertical shades show routine (yellow) or extra (grey) cage changes. Middle column displays tissue distribution of ANDV RNA per gram of tissue or milliliter of blood. The dashed horizontal grey line shows the inoculum dose. Right column displays results of nucleocapsid ELISA of serum collected at euthanasia. Antinucleocapsid serum titers are noted for animals that seroconverted. The assay cutoff is shown as a black curve with vertical line-ranges (mean +3 SD) of each serum dilution. To improve figure visualization, the y-axes in panels A–C were log10-transformed. Bla, bladder; Bld, blood; cLN, cervical lymph node; Hrt, heart; ID, identification; Li, liver; Lu, lung; OD405, Optical density at 405 nm; Rec, rectum; RSD, reciprocal serum dilutions; Sp, spleen.

Main Article

Page created: September 15, 2023
Page updated: September 20, 2023
Page reviewed: September 20, 2023
The conclusions, findings, and opinions expressed by authors contributing to this journal do not necessarily reflect the official position of the U.S. Department of Health and Human Services, the Public Health Service, the Centers for Disease Control and Prevention, or the authors' affiliated institutions. Use of trade names is for identification only and does not imply endorsement by any of the groups named above.
file_external