Volume 29, Number 2—February 2023
Research
Early Introduction and Community Transmission of SARS-CoV-2 Omicron Variant, New York, New York, USA
Dakai Liu1, Yexiao Cheng1, Hangyu Zhou, Lulan Wang, Roberto Hurtado Fiel, Yehudah Gruenstein, Jean Jingzi Luo, Vishnu Singh, Eric Konadu, Keither James, Calvin Lui, Pengcheng Gao, Carl Urban, Nishant Prasad, Sorana Segal-Maurer, Esther Wurzberger, Genhong Cheng , Aiping Wu , and William Harry Rodgers
Figure 2
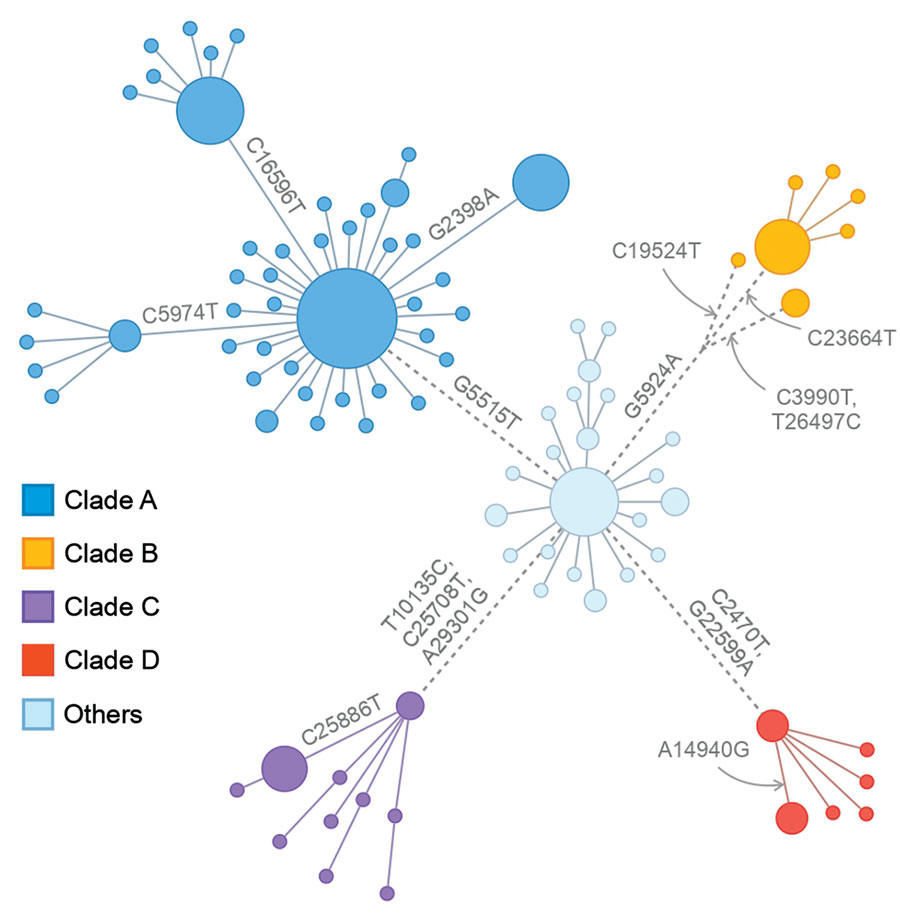
Figure 2. Genotype network of 392 Omicron viruses from New York, New York, USA, November 25–December 11, 2021. In this network, nodes represent nucleotide genotypes by clade, and lines between nodes represent pairs of nucleotide genotypes with the highest genetic similarity. Node size is scaled to log2 of the number of viruses with the corresponding genotype. Dashed lines indicate pairs of similar genotypes of different clades.
1These authors contributed equally to this article.
Page created: January 11, 2023
Page updated: January 21, 2023
Page reviewed: January 21, 2023
The conclusions, findings, and opinions expressed by authors contributing to this journal do not necessarily reflect the official position of the U.S. Department of Health and Human Services, the Public Health Service, the Centers for Disease Control and Prevention, or the authors' affiliated institutions. Use of trade names is for identification only and does not imply endorsement by any of the groups named above.