Use of High-Resolution Geospatial and Genomic Data to Characterize Recent Tuberculosis Transmission, Botswana
Chelsea R. Baker
1, Ivan Barilar
1, Leonardo S. de Araujo, Anne W. Rimoin, Daniel M. Parker, Rosanna Boyd, James L. Tobias, Patrick K. Moonan, Eleanor S. Click, Alyssa Finlay, John E. Oeltmann, Vladimir N. Minin, Chawangwa Modongo, Nicola M. Zetola
2, Stefan Niemann
2, and Sanghyuk S. Shin
2
Author affiliations: University of California, Irvine, California, USA (C.R. Baker, D.M. Parker, V.N. Minin, S.S. Shin); Forschungszentrum, Borstel, Germany (I. Barilar, L.S. de Araujo, S. Niemann); University of California, Los Angeles, California, USA (A.W. Rimoin); US Centers for Disease Control and Prevention, Gaborone, Botswana (R. Boyd, A. Finlay); US Centers for Disease Control and Prevention, Atlanta, Georgia, USA (J.L. Tobias, P.K. Moonan, R. Boyd, E.S. Click, A. Finlay, J.E. Oeltmann); Botswana–UPenn Partnership, Gaborone (C. Modongo, N.M. Zetola); Victus Global Botswana Organisation, Gaborone (C. Modongo, N.M. Zetola)
Main Article
Figure 2
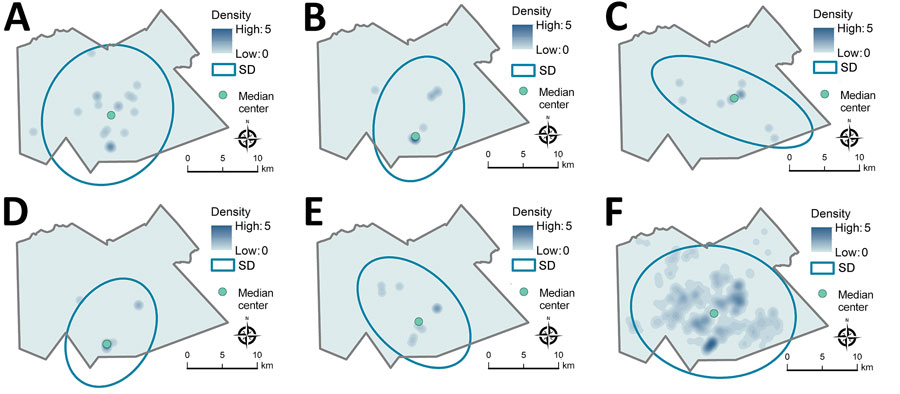
Figure 2. Kernel density map, median center point, and directional distribution for genotypic groups A–E (≤5 single-nucleotide polymorphisms) (panels A–E) and genotypically ungrouped Mycobacterium tuberculosis strains (F) in study of high-resolution geospatial and genomic data to characterize recent tuberculosis transmission, Gaborone, Botswana, 2012–2016. The blue ovals encompass the area within the SD ellipse, representing the geographic distance and directional orientation of participant locations within each group. Density is shown on a different scale (up to 35 cases/km2) for ungrouped participants than for participants in the genotypic cluster groups (up to 5 cases/km2) because of differences in size of the datasets.
Main Article
Page created: January 18, 2023
Page updated: April 18, 2023
Page reviewed: April 18, 2023
The conclusions, findings, and opinions expressed by authors contributing to this journal do not necessarily reflect the official position of the U.S. Department of Health and Human Services, the Public Health Service, the Centers for Disease Control and Prevention, or the authors' affiliated institutions. Use of trade names is for identification only and does not imply endorsement by any of the groups named above.