Volume 29, Number 5—May 2023
Research
Use of High-Resolution Geospatial and Genomic Data to Characterize Recent Tuberculosis Transmission, Botswana
Chelsea R. Baker1, Ivan Barilar1, Leonardo S. de Araujo, Anne W. Rimoin, Daniel M. Parker, Rosanna Boyd, James L. Tobias, Patrick K. Moonan, Eleanor S. Click, Alyssa Finlay, John E. Oeltmann, Vladimir N. Minin, Chawangwa Modongo, Nicola M. Zetola2, Stefan Niemann2, and Sanghyuk S. Shin2
Figure 5
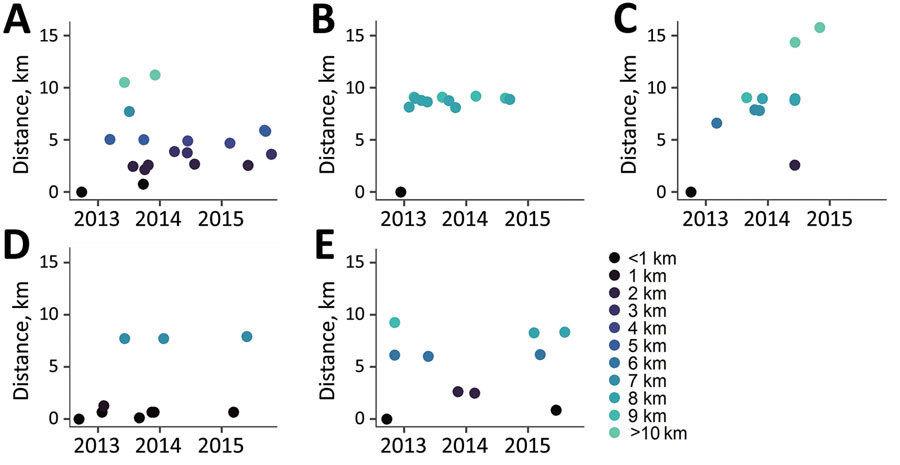
Figure 5. Incident tuberculosis by geographic distance from first study participant by genotypic cluster group (≤5 single-nucleotide polymorphisms) in study of high-resolution geospatial and genomic data to characterize recent tuberculosis transmission, Gaborone, Botswana, 2012–2016. Plots represent each participant by date of tuberculosis diagnosis and by geographic distance (based on participant’s primary residence) from the first participant (shown in each plot at a distance of 0 km) in each genotypic cluster group.
1These first authors contributed equally to this article.
2These senior authors contributed equally to this article.
Page created: January 18, 2023
Page updated: April 18, 2023
Page reviewed: April 18, 2023
The conclusions, findings, and opinions expressed by authors contributing to this journal do not necessarily reflect the official position of the U.S. Department of Health and Human Services, the Public Health Service, the Centers for Disease Control and Prevention, or the authors' affiliated institutions. Use of trade names is for identification only and does not imply endorsement by any of the groups named above.