Effect of Norovirus Inoculum Dose on Virus Kinetics, Shedding, and Symptoms
Yang Ge

, W. Zane Billings, Antone Opekun, Mary Estes, David Graham, Juan Leon, Katia Koelle, Ye Shen, Robert Atmar, Benjamin Lopman, and Andreas Handel
Author affiliations: University of Southern Mississippi School of Health Professions, Hattiesburg, Mississippi, USA (Y. Ge); University of Georgia, Athens, Georgia, USA (W.Z. Billings, Y. Shen, A. Handel); Baylor College of Medicine, Houston, Texas, USA (A. Opekun, M. Estes, D. Graham, R. Atmar); Emory University, Atlanta, Georgia, USA (J. Leon, K. Koelle, B. Lopman)
Main Article
Figure 2
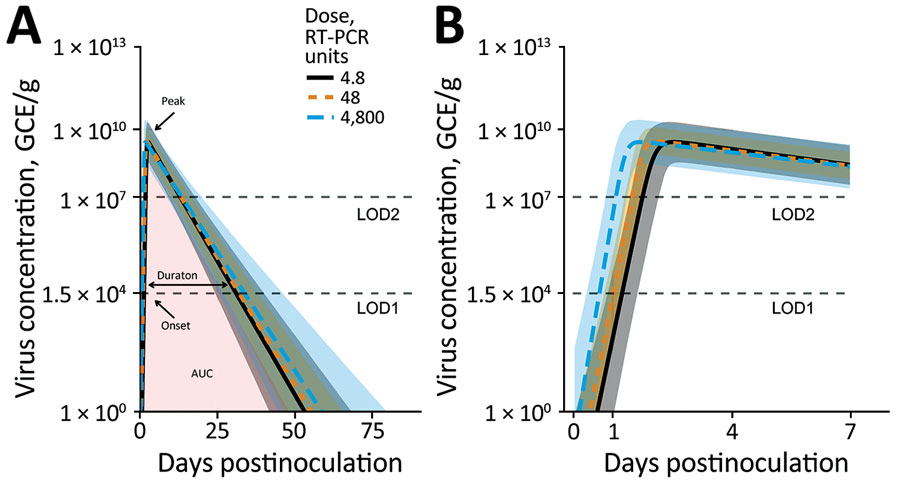
Figure 2. Fitted virus concentration (GEC/g) in feces of patients challenged with norovirus in study of the effect of norovirus inoculum dose on virus kinetics, shedding, and symptoms. A) Fitted curves showing the full infection time-course. Onset is time at which virus load rose to the LOD1 level. Duration is amount of time where virus load was above the LOD1 level. Peak is time to virus peak shedding. B) Zoomed in plot of the first 7 days to better show the initial increase and peak. Curves and shaded regions indicate means and credible intervals of the fitted time series Bayesian model. LOD1 and LOD2 lines indicate the 2 different limits of detection. Missing values attributable to limits of detection were treated as censors (Appendix). AUC, area under virus concentration curve; GEC, genomic equivalent copies; LOD, limit of detection; RT-PCR, reverse transcription PCR.
Main Article
Page created: May 09, 2023
Page updated: June 20, 2023
Page reviewed: June 20, 2023
The conclusions, findings, and opinions expressed by authors contributing to this journal do not necessarily reflect the official position of the U.S. Department of Health and Human Services, the Public Health Service, the Centers for Disease Control and Prevention, or the authors' affiliated institutions. Use of trade names is for identification only and does not imply endorsement by any of the groups named above.