Skip directly to site content Skip directly to page options Skip directly to A-Z link Skip directly to A-Z link Skip directly to A-Z link
Volume 29, Number 8—August 2023
Research

Prospecting for Zoonotic Pathogens by Using Targeted DNA Enrichment

Egie E. Enabulele, Winka Le Clec’h, Emma K. Roberts, Cody W. Thompson, Molly M. McDonough, Adam W. Ferguson, Robert D. Bradley, Timothy J. C. Anderson, and Roy N. PlattComments to Author 
Author affiliations: Texas Biomedical Research Institute, San Antonio, Texas, USA (E.E. Enabulele, W. Le Clec’h, T.J.C. Anderson, R.N. Platt II); Texas Tech University, Lubbock, Texas, USA (E.K. Roberts, R.D. Bradley); University of Michigan, Ann Arbor, Michigan, USA (C.W. Thompson); Chicago State University, Chicago, Illinois, USA (M.M. McDonough); Field Museum of Natural History, Chicago (A.W. Ferguson)

Main Article

Figure 4

Identifying pathogen reads from controls and museum-archived tissue samples for study of prospecting for zoonotic pathogens by using targeted DNA enrichment. Control reads are indicated by the percentage of pathogen DNA 1% or 0.001%. A) Reads were compared with a database of target loci and assigned a taxonomic classification based on these results. Reads were assigned to 93 genera; of those, 17 (shown) were present in >1 sample, including controls, with ≥1,000 reads. A heatmap of those results shows the relative proportion of reads assigned to each genus. Details of samples are provided in Table 2. B–D) Coverage at each probed locus is shown across all control samples for Mycobacterium (B), Plasmodium (C), and Schistosoma (D). Each point in the chart is coverage calculated at a single target locus. Horizontal lines within boxes indicate medians, box tops and bottoms indicate lower and upper quartiles, and whiskers represent minimum and maximum values, excluding outliers. Each sample is indicated with a circle. E, enriched.

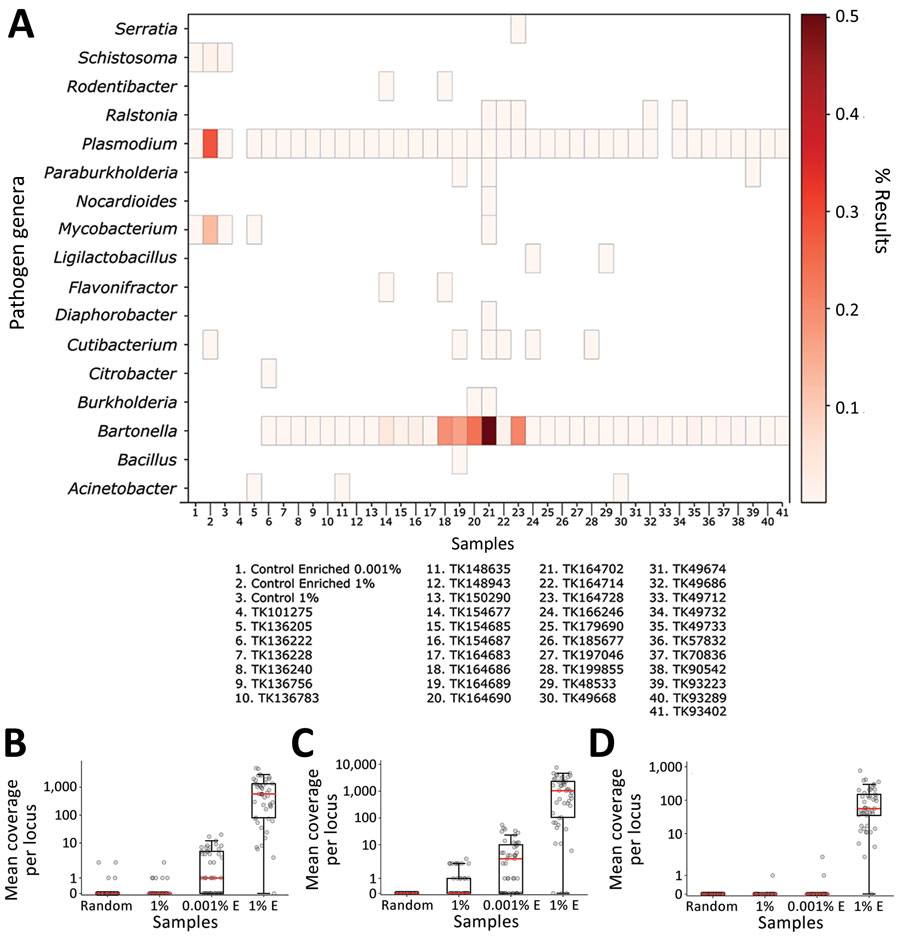
Figure 4. Identifying pathogen reads from controls and museum-archived tissue samples for study of prospecting for zoonotic pathogens by using targeted DNA enrichment. Control reads are indicated by the percentage of pathogen DNA 1% or 0.001%. A) Reads were compared with a database of target loci and assigned a taxonomic classification based on these results. Reads were assigned to 93 genera; of those, 17 (shown) were present in >1 sample, including controls, with ≥1,000 reads. A heatmap of those results shows the relative proportion of reads assigned to each genus. Details of samples are provided in Table 2. B–D) Coverage at each probed locus is shown across all control samples for Mycobacterium (B), Plasmodium (C), and Schistosoma (D). Each point in the chart is coverage calculated at a single target locus. Horizontal lines within boxes indicate medians, box tops and bottoms indicate lower and upper quartiles, and whiskers represent minimum and maximum values, excluding outliers. Each sample is indicated with a circle. E, enriched.

Main Article

Page created: June 07, 2023
Page updated: July 20, 2023
Page reviewed: July 20, 2023
The conclusions, findings, and opinions expressed by authors contributing to this journal do not necessarily reflect the official position of the U.S. Department of Health and Human Services, the Public Health Service, the Centers for Disease Control and Prevention, or the authors' affiliated institutions. Use of trade names is for identification only and does not imply endorsement by any of the groups named above.
file_external