Volume 29, Number 8—August 2023
Research
Prospecting for Zoonotic Pathogens by Using Targeted DNA Enrichment
Abstract
More than 60 zoonoses are linked to small mammals, including some of the most devastating pathogens in human history. Millions of museum-archived tissues are available to understand natural history of those pathogens. Our goal was to maximize the value of museum collections for pathogen-based research by using targeted sequence capture. We generated a probe panel that includes 39,916 80-bp RNA probes targeting 32 pathogen groups, including bacteria, helminths, fungi, and protozoans. Laboratory-generated, mock-control samples showed that we are capable of enriching targeted loci from pathogen DNA 2,882‒6,746-fold. We identified bacterial species in museum-archived samples, including Bartonella, a known human zoonosis. These results showed that probe-based enrichment of pathogens is a highly customizable and efficient method for identifying pathogens from museum-archived tissues.
Many serious human pathogens result from zoonotic transmission, including 61% of known human pathogens and 75% of emerging human pathogens (1). For example, rabies virus is transmitted by saliva of infected animals (2). The plague bacteria (Yersina pestis), the causative agent of the largest documented pandemic in human history that reduced the population of Europe by 30%–50%, was transmitted from rats to humans by fleas (3). Other zoonoses include Ebola virus (4), tularemia (Francisella tularensis) (5), and tuberculosis (6). The SARS-CoV-2 pandemic, thought to have a bat reservoir, has stimulated renewed emphasis on zoonotic pathogen surveillance (7,8).
Natural history museums are repositories of biologic information in the form of voucher specimens that represent a major, underused resource for studying zoonotic pathogens (9–13). Originally, specimens were archived as dried skin and skeletal vouchers or preserved in fluids (ethanol) after fixation with formalin or formaldehyde. Now, best practices include preserving specimens and associated soft tissues in liquid nitrogen (−190°C) or mechanical freezers (−80°C) from the time they are collected (14). Those advances in preservation make it possible to extract high-quality DNA and RNA that can be used for pathogen surveillance. For example, retroactive sampling of archived tissues from the US Southwest found that Sin Nombre virus, a New World hantavirus, was circulating in wild rodent populations almost 20 years before the first human cases were reported (15).
It is critical to develop a range of tools for extracting pathogen information from museum-archived samples. Targeted sequencing using probe enrichment has become the tool of choice for medical genomics (16), population genetics (17), phylogenetics (18), and ancient DNA (19,20). Those methods are designed to enrich small amounts of DNA target from a background of contaminating DNA. Probe-based, targeted sequencing has been used to enrich pathogens from complex host‒pathogen DNA mixtures (21). For example, Keller et al. used probes to capture and sequence complete Y. pestis genomes from burial sites >1,500 years old (22). Enrichment is frequently achieved by designing a panel of probes to specifically target a handful of pathogens of interest (23,24). Similarly, commercial probe sets are available for many types of viruses and human pathogens (23–25). However, many of these probe sets are limited to specific pathogens that might not infect other host species.
Figure 1
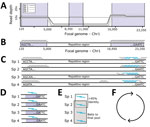
Figure 1. Probe panel design for study of prospecting for zoonotic pathogens by using targeted DNA enrichment. A) Simulated reads from each pathogen within a group were mapped back to a single...
Figure 2
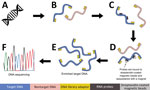
Figure 2. Targeted DNA enrichment workflow for study of prospecting for zoonotic pathogens by using targeted DNA enrichment. A) Genomic DNA extracted using the DNeasy Kit (QIAGEN, https://www.qiagen.com). B) Next-generation...
Our goal was to develop a panel of biotinylated baits, or probes, to identify the eukaryotic and bacterial pathogens responsible for 32 major zoonoses (Table 1). We aimed to capture both known and related pathogens, using the fact that probes can capture sequences that are ≤10% divergent. To perform this capture, we used a modified version of the ultraconserved element (UCE) targeted sequencing technique (26,27) to specifically enrich pathogen DNA. Biotinylated baits are designed to target conserved genomic regions among diverse groups of pathogens (Figure 1). The baits are hybridized to a library potentially containing pathogen DNA. Bait-bound DNA fragments are enriched during a magnetic bead purification step before sequencing (Figure 2). The final library contains hundreds or thousands of orthologous loci with single-nucleotide variants or indels from the targeted pathogen groups that can then be used for population or phylogenetic analyses.
We have compiled a detailed description of the methods used (Appendix 1; https://doi.org/10.17504/protocols.io.5jyl8jnzrg2w/v1). Code is available on GitHub (https://www.github.com/nealplatt/pathogen_probes; https://doi.org/10.5281/zenodo.7319915). Raw sequence data are available from the National Center for Biotechnology Information (BioProject PRJNA901509; Appendix 2). A summary of our methods follows.
Panel Development
We developed a panel of baits for targeted sequencing of 32 zoonotic pathogens. To develop this panel, we used the Phyluce version 1.7.1 (26,27) protocol to design baits for conserved loci within each pathogen group. First, we simulated and mapped reads from each species within a pathogen group to a focal genome assembly (Table 1; Figure 1, panel A). We used the mapped reads to identify putative orthologous loci that were >80% similar across the group and generated in silico baits from the focal genome (Figure 1, panel B). These baits were mapped back to each member (Figure 1, panel C) to identify single-copy orthologs within the group. Next, we designed 2 overlapping 80-bp baits from loci in each member of the group (Figure 1, panel D) and removed baits with >95% sequence similarity (Figure 1, panel E). We repeated those steps for each pathogen group (Figure 1, panel F). We compared the remaining baits with mammalian genomes and replaced them to minimize cross-reactivity with the host. Finally, we combined baits to capture 49 loci from each pathogen group into a panel that was synthesized by Daicel Arbor Biosciences (https://arborbiosci.com).
Museum-Archived and Control Samples
We extracted DNA from 38 museum samples by using the DNeasy Kit (QIAGEN, https://www.qiagen.com) (Table 2). We generated control samples by spiking naive mouse DNA with 1% microorgamism DNA from Mycobacterium bovis, M. tuberculosis, Plasmodium vivax, P. falciparum, and Schistosoma mansoni. We then further diluted an aliquot of this 1% pathogen mixture into mouse DNA to create a 0.001% host‒pathogen mixture. This range was designed to test the lower limits of detection but also represent a reasonable host‒pathogen proportion. For example, Theileria parva, a tick-transmitted apicomplexan, is present in samples from 0.9% through 3% (28), and 1.5% of DNA sequence reads in clinical blood samples is from P. vivax (29).
Library Preparation
We generated standard DNA sequencing libraries from 500 ng of DNA per sample. We combined individual libraries with similar DNA concentrations into pools of 4 samples and used the myBaits version 5 (Daicel Arbor Biosciences) high sensitivity protocol to enrich target loci. We used 2 rounds of enrichment (24 h at 65°C), washed away unbound DNA, and amplified the remainder for 15 cycles before pooling for sequencing.
Classifying Reads
Figure 3
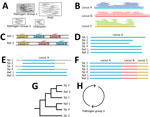
Figure 3. Building phylogenies from parasite reads for study of prospecting for zoonotic pathogens by using targeted DNA enrichment. A) After read classification, we extracted all the reads associated with a pathogen...
First, we generated a dataset of target loci by mapping the probes to representative and reference genomes in RefSeq v212 with BBMap v38.96 (30). For each probe, we kept the 10 best sites that mapped with >85% sequence identity along with 1,000 bp upstream and downstream. These sequences were combined into a database to classify reads by using Kraken2 version 2.1.1 (31) (Figure 3, panel A). Next, we extracted pathogen reads with KrakenTools version 1.2 (https://github.com/jenniferlu717/KrakenTools). We assembled those reads (Figure 3, panel B) with the SPAdes genome assembler version 3.14.1 (32) and filtered them to remove low quality contigs (<100 bp and <10× median coverage). We removed samples that had <2 contigs from downstream analyses. During this time, we extracted target loci in available reference genomes (Figure 3, panel C). Next, we identified (Figure 3, panel D), aligned and trimmed (Figure 3, panel E) orthologs before concatenating them into a single alignment (Figure 3, panel F). Finally, we generated and bootstrapped a phylogenetic tree (Figure 3, panel G) by using RaxML-NG version 1.0.1 (33). We repeated those steps for each pathogen group (Figure 3, panel H).
Host Identification
There were sufficient mtDNA sequences from most samples to verify museum identifications by comparing reads to a Kraken2 version 2.1.2 (31) database of mammalian mitochondrial genomes. We filtered the classifications by removing samples with <50 classified reads and single-read, generic classifications.
Panel Development
We used the ultraconserved element protocol developed by Faircloth et al. (26,27) to develop a set of 39,893 biotinylated baits that target 32 pathogen groups responsible for 32 zoonoses. Each pathogen group is targeted at 49 loci with a few diverse taxa, Bacillus cereus and Trypanosoma species, targeted at 98 loci. We complied information on pathogen groups, focal taxa, genome accessions, and number of baits (Table 3).
Control Samples
Figure 4
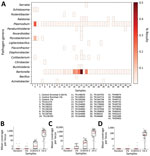
Figure 4. Identifying pathogen reads from controls and museum-archived tissue samples for study of prospecting for zoonotic pathogens by using targeted DNA enrichment. Control reads are indicated by the percentage of pathogen...
We tested the efficacy of our bait set on laboratory-made host‒pathogen mixtures containing DNA from Mus musculus, Mycobacterium tuberculosis, Plasmodium falciparum, P. vivax and Schistosoma mansoni. We generated 4 control samples containing either 1% or 0.001% pathogen DNA that was enriched or not enriched. We classified reads against the database of target loci and found that 42.7% of all reads (Mycobacterium = 13.1%, Plasmodium = 28.1%, Schistosoma = 1.5%) were from control pathogens in the 1% enriched control sample. However, only 0.03% of the corresponding 1% unenriched control was from target loci. Aside from the raw percentages, we compared the coverage of each probed region in the 1% enriched and unenriched control samples (Figure 4, panels B‒D) to understand how enrichment effected coverage at each locus. Mean coverage per Mycobacterium locus increased from 0.14× to 944.5× (6,746-fold enrichment), 0.53× to 1,527.4× for Plasmodium loci (2,882-fold enrichment), and 0.02× to 117.9× (5,895-fold enrichment) for schistosome loci. Because the sequencing library from the 0.001% unenriched sample did not work during the sequencing reaction, we do not have a baseline to examine enrichment in the 0.001% samples.
Figure 5
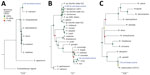
Figure 5. Phylogenetic analysis of pathogens used in control samples for study of prospecting for zoonotic pathogens by using targeted DNA enrichment. A) Schistosoma; B) Plasmodium; C) ...
We extracted reads assigned to each pathogen group and assembled and aligned them with target loci extracted from reference genomes of closely related species by using tools from Phyluce version 1.7.1 (26,27). We were able to assemble 0–23 target loci per pathogen group in the control samples (Table 4). Assembled loci varied in size from 109 to 1,991 bp (median 636.5 bp). For each sample/group with >2 loci captured, we generated a phylogenetic tree along with other members of the taxonomic group (Figure 5). In each case, pathogen loci from the control samples were sister groups to the appropriate reference genome with strong bootstrap support. For example, the Schistosoma loci assembled from the 1% enriched control sample were sister to the S. mansoni genome (GCA000237925) in 100% of bootstrap replicates.
Museum Samples
Next, we tested our bait set on museum-archived tissues. We generated 649.3 million reads across all 38 samples (mean 17.1 million reads/sample). An initial classification showed that, on average, 4.3% of reads were assignable to loci in the database. Those reads were designated to 93 genera. However, 78 of those genera were at low frequency (<1,000 reads/sample) (Figure 4). Many of the low frequency hits are likely the result of bioinformatic noise. Bartonella and Plasmodium species were the most common genera; each was present in 36 of 38 museum samples. The distribution of Bartonella reads was strongly bimodal such that 18 samples had <12 reads and 18 samples had >1,000 reads (median 552 reads/sample). In 5 samples, the percentage of Bartonella reads was exceedingly high (>10%). In comparison, the median number of Plasmodium reads never exceeded 0.04% of reads from a single museum sample (mean 158.5 reads/sample).
Figure 6
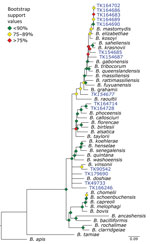
Figure 6. Phylogenetic analysis of Bartonellausing museum archived samples in study of prospecting for zoonotic pathogens by using targeted DNA enrichment. Blue indicates museum archived samples; museum accession numbers are...
Figure 7
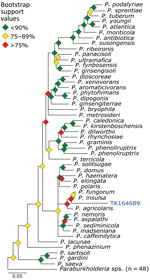
Figure 7. Phylogenetic analysis of Paraburkholderiausing museum archived samples for probe panel for prospecting zoonotic pathogens by using targeted DNA enrichment. Blue indicates museum archived samples; museum accession numbers are...
Figure 8
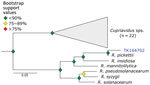
Figure 8. Phylogenetic analysis of Ralstoniausing museum archived samples in study of prospecting for zoonotic pathogens by using targeted DNA enrichment. Blue indicates museum archived samples; museum accession numbers are...
We used phylogenetic analyses and rules of monophyly to identify putative pathogens to species or strain for each of the 15 genera with >1,000 reads (Figure 4, panel A). We were unable to assemble >1 target locus for any specimen in 13 genera. We were able to assemble 3–20 loci (mean = 8 loci per sample) from 16 samples containing Bartonella (Figure 6), 3 loci from a sample containing Paraburkholderia reads (Figure 7), and 8 loci from a sample containing Ralstonia reads (Figure 8).
We used phylogenetic analyses and rules of monophyly to identify putative pathogens to species or strain for each of the 15 genera with >1,000 reads (Figure 4, panel A). We were unable to assemble >1 target locus for any specimen in 13 genera. We were able to assemble 3–20 loci (mean 8 loci/sample) from 16 samples containing Bartonella (Figure 6), 3 loci from a sample containing Paraburkholderia reads (Figure 7), and 8 loci from a sample containing Ralstonia reads (Figure 8).
Host Identification
Figure 9
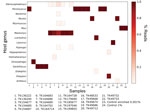
Figure 9. Genetic identification of mammal host from unenriched, mitochondrial reads in study of prospecting for zoonotic pathogens by using targeted DNA enrichment. Reads were compared with a database of mammalian mitochondria...
We compared reads from each sample to a database of mitochondrial genomes to identify the host. In general, reads from the mitochondria comprised a small proportion (<1%, mean 0.04%) of each sample (Figure 9). Despite the low number of mitochondrial reads, generic classifications from the mitochondrial database coincided with the museum identifications after filtering samples with <50 mitochondrial reads. For the remaining samples, the correct genus was identified by >85% (mean 98%) of reads from that sample. Classifying reads less than the generic level is limited by mitochondrial genome availability, but where possible, we were able to confirm museum identifications at the species level.
We developed a set of 39,893 biotinylated baits for targeted sequencing of >32 zoonotic pathogens, and their relatives, from host DNA samples. To test the efficacy of the bait panel, we used 4 control samples that contained either 1% or 0.001% pathogen DNA and further subdivided into pools that were enriched and unenriched. Our results (Figure 4) showed a large increase of pathogen DNA in the 1% enriched sample when compared with its unenriched counterpart. Specifically, enrichment increased the amount of pathogen DNA from 0.03% to 42.1%.
We were able to generate phylogenetically informative loci from Plasmodium, Mycobacterium, and Schistosoma species in the 1% enriched control sample. On the basis of genome size, we estimate genome copies as 91,611 for Plasmodium, 261,030 for Mycobacterium, and 3,159 for Schistosoma in the control sample. This finding indicates that the probe set is able to detect these pathogens from even a few thousand genome copies per sample (Schistosoma species). In contrast, we were only able to generate phylogenetically informative loci from P. falciparum in 0.001% enriched sample, which would hypothetically contain ≈39 genome copies. This finding implies that the bait set might be capable of identifying pathogens present in samples with only a few hundred genome copies. However, there are limitations to Plasmodium detection that should be considered.
In each sample, reads were detected from only a few loci rather than from the entire genome. For example, in the 1% enriched sample, 5,879 of the 398,469 reads came from 32 loci totaling 19.6 kb. Had the unenriched sample contained the same number of reads, randomly distributed across the genome, it would have amounted to 1 read every 62 kb. We found that enrichment increased coverage at probed loci from 0.23× to 863.3×, a 3,732.3-fold increase when averaged across all pathogens/loci (Figure 4). Those results show that although large amounts of host DNA might remain in a sample, the targeted loci are greatly enriched.
We tested the panel of baits on 38, museum-archived, small mammal samples without previous knowledge of infection history. Reads from these samples were initially designated to 93 different genera, but most of these genera contained a limited number of reads. For example, almost half of the 93 genera (n = 43) were identified on the basis of a single read across all 38 samples, most likely a bioinformatic artifact. We identified 15 genera in which 1 sample had >1,000 reads. For each of these 15 genera, we extracted any reads classified within the same family (e.g., genus Bartonella, family Bartonellaceae) and assembled, aligned, and trimmed them for phylogenetic analyses. In most cases, the reads failed the assembly step (n = 6), were filtered on the basis of locus size or coverage (n = 5), or assembled into multiple loci that were not targeted by our bait set (n = 2); we did not pursue those reads any further. However, we were able to generate phylogenies for specimens positive for Bartonella, Ralstonia, and Paraburkholderia species.
Bartonella is a bacterial genus responsible for cat-scratch disease, Carrión’s disease, and trench fever (34). Transmission often occurs between humans and their pets or from infected fleas ticks, or other arthropod vectors (35). We were able to recover target loci for 14 of 36 specimens. A phylogeny of Bartonella species placed the museum samples in multiple clades (Figure 6). For example, 5 specimens formed a monophyletic clade sister to B. mastomydis. B. mastomydis recently was described from Mastomys erythroleucus mice collected in Senegal (36). Appropriately, the samples we tested were collected from M. natalensis mice from Botswana (Table 2). Another clade contained B. vinsonii and a Sigmodon rat (TK90542) collected in Mexico. Zoonotic transmission of B. vinsonii has been implicated in neurologic disorders (37). Other museum samples probably contain novel Bartonella species/strains or at least represent species/strains without genomic references.
Paraburkholderia is a genus of bacteria commonly associated with soil microbiomes and plant tissues. We identified Paraburkholderia reads in 3 specimens and were able to place 1 of those in a phylogeny sister to a clade containing P. fungorum and P. insulsa. Because bootstrap values across the phylogeny were moderate in general, and weak in this particular region (Figure 7), placement of this sample is tenuous. P. fungorum is the sole member of Paraburkholderia believed to be capable of infecting humans, but it is only a rare, opportunistic, human pathogen (38–40).
Ralstonia is a bacteria genus closely related to the genus Pseudomonas. We identified Ralstonia reads in 5 samples and were able to place a specimen on a phylogeny. This sample is closely affiliated with R. pickettiii (Figure 8). We are unaware of any examples of zoonotic transmission of R. pickettii. Rather, R. pickettii has been identified as a common contaminant in laboratory reagents (41), and outbreaks have been caused by contaminated medical supplies (42). We failed to identify nucleic acids in any of our negative controls during library preparation. Furthermore, if there were systemic contamination, we would expect to find Ralstonia species in all of our samples, rather than the 5 of 36 observed. Thus, because we cannot rule out reagent contamination, the presence of Ralstonia species in the museum samples should be interpreted with caution.
Figure 10
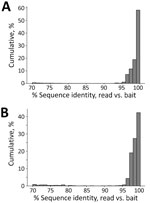
Figure 10. Sequence identity between enriched reads and baits in the probe panel used for targeting zoonotic pathogens in study of prospecting for zoonotic pathogens by using targeted DNA enrichment. Reads from...
We were able to capture, sequence, and assemble loci from taxa that were not represented in the databases used to design the bait panel. This ability was possible for 2 reasons. First, the bait panel is highly redundant. The baits are sticky and able to capture nucleic acid fragments that are <10%–12% divergent (43). We designed the panel with <5% sequence divergence between any pair of baits at a particular locus (Figure 10). Second, sampled loci within each pathogen group spanned a range of divergences. Conserved loci were more likely to catch more divergent species that might not have been present in our initial dataset. For example, we recovered multiple species of Bartonella that were not present in our probe set, for which related genomes were available. However, for Ralstonia and Paraburkholderia species, we identified these samples from reads targeted by probes for the genus Burkholderia, a pathogenic taxon in the same family (Burkholderacea). The ability to identify taxa at these distances is because of the more conserved loci targeted by the bait panel.
During the initial read classification stage, we identified low levels of Plasmodium species in all but 2 museum samples, which was unexpected. Museum samples contained <3,221 Plasmodium reads/sample (mean 428.3 reads/sample), but we were unable to assemble them into loci for phylogenetic analyses. This limitation effectively removed those samples from downstream analyses. The P. falciparum genome is extremely AT rich (82%, 44), which might result in bioinformatic false-positive results. We suspect that AT-rich, low-complexity regions of the host genome are misclassified as parasite reads. To test this hypothesis, we used fqtrim 0.9.7 (https://ccb.jhu.edu/software/fqtrim) to identify and remove low-complexity sequences within those reads. This filter by itself reduced the number of Plasmodium reads in the museum samples by 75.5% (maximum 298 reads, mean 57.2 reads). In comparison, only 8.2% of reads from 0.001% enriched control samples and 0.2% of reads from 1% enriched control samples were removed.
Several technical issues still need to be addressed. First, enrichment increases the targeted loci coverage by 3 orders of magnitude. However, the amount of host DNA remaining in each sample is still high. Ideally, host DNA would be rare or absent. Second, the bait panel requires relatively large up-front costs. Third, although the bait panel is developed to target a wide range of taxa, it is not possible to know which species are missed. The best way to circumvent that issue is to use controls spiked with various pathogens of interest, similar to how mock communities are used in other metagenomic studies (45). Those mock controls are commercially available for bacterial communities (e.g., ZymoBIOMICS Microbial Community Standards; Zymo Research, http://www.zymoresearch.com), but we have been unable to find similar products that contain eukaryotic pathogens. Solutions to those problems will make targeted sequencing with bait panels a viable tool for pathogen surveillance. Fourth, the sensitivity of the probes will depend on the sequence divergence between the probes and pathogen DNA. The more diverged the 2 are, the less efficient the capture will be. This limitation indicates that pathogen groups that have biased or limited genomic data will be less likely to capture off-target species once divergence increases by >5%–10%. Finally, the current probe panel is capable of capturing and identifying pathogens if there are >3,000 genome copies in the sample. Sensitivity needs to be improved in future iterations of the panel. One method could be to target pathogen-specific, repetitive sequences (46). Because those sequences are already present in the genome hundreds to thousands of times, it should be possible to greatly increase the sensitivity of the probe panel.
Although further effort is required to resolve these issues, we believe that enrichment of pathogen DNA from museum tissue samples is a viable tool worth further development. In its current form, enrichment represents a coarse tool that can be used to scan for various pathogens from archived tissues. More refined tests, such as quantitative PCR and targeted sequencing, can be used to answer taxon-specific questions. Target enrichment will be necessary for maximizing the pathogen data that are available from the hundreds of thousands of museum-archived tissues and will play a critical role in understanding our susceptibility to future zoonotic outbreaks.
Dr. Enabulele is a postdoctoral research associate at the Texas Biomedical Research Institute, San Antonio, TX. His primary research interests are public health parasitology, neglected tropical diseases, and pathogen genomics.
Acknowledgments
We thank Sandy Smith, John Heaner, Larry Schlesinger, Ian Cheeseman, and Frederic Chevalier for providing computational and laboratory support and Kathy McDonald, Heath Garner, and Caleb Phillips for providing small mammal tissues.
This study was supported by the Texas Biomedical Research Forum (grant 19-04773).
References
- Plowright RK, Parrish CR, McCallum H, Hudson PJ, Ko AI, Graham AL, et al. Pathways to zoonotic spillover. Nat Rev Microbiol. 2017;15:502–10. DOIPubMedGoogle Scholar
- Dean DJ, Evans WM, McClure RC. Pathogenesis of rabies. Bull World Health Organ. 1963;29:803–11.PubMedGoogle Scholar
- Perry RD, Fetherston JD. Yersinia pestis—etiologic agent of plague. Clin Microbiol Rev. 1997;10:35–66. DOIPubMedGoogle Scholar
- Leroy EM, Epelboin A, Mondonge V, Pourrut X, Gonzalez J-P, Muyembe-Tamfum J-J, et al. Human Ebola outbreak resulting from direct exposure to fruit bats in Luebo, Democratic Republic of Congo, 2007. Vector Borne Zoonotic Dis. 2009;9:723–8. DOIPubMedGoogle Scholar
- Petersen JM, Schriefer ME. Tularemia: emergence/re-emergence. Vet Res. 2005;36:455–67. DOIPubMedGoogle Scholar
- Müller B, Dürr S, Alonso S, Hattendorf J, Laisse CJ, Parsons SD, et al. Zoonotic Mycobacterium bovis-induced tuberculosis in humans. Emerg Infect Dis. 2013;19:899–908. DOIPubMedGoogle Scholar
- Jo WK, de Oliveira-Filho EF, Rasche A, Greenwood AD, Osterrieder K, Drexler JF. Potential zoonotic sources of SARS-CoV-2 infections. Transbound Emerg Dis. 2021;68:1824–34. DOIPubMedGoogle Scholar
- van Aart AE, Velkers FC, Fischer EAJ, Broens EM, Egberink H, Zhao S, et al. SARS-CoV-2 infection in cats and dogs in infected mink farms. Transbound Emerg Dis. 2022;69:3001–7. DOIPubMedGoogle Scholar
- Colella JP, Bates J, Burneo SF, Camacho MA, Carrion Bonilla C, Constable I, et al. Leveraging natural history biorepositories as a global, decentralized, pathogen surveillance network. PLoS Pathog. 2021;17:
e1009583 . DOIPubMedGoogle Scholar - McLean BS, Bell KC, Dunnum JL, Abrahamson B, Colella JP, Deardorff ER, et al. Natural history collections-based research: progress, promise, and best practices. J Mammal. 2016;97:287–97. DOIPubMedGoogle Scholar
- Cook JA, Arai S, Armién B, Bates J, Bonilla CAC, Cortez MBS, et al. Integrating biodiversity infrastructure into pathogen discovery and mitigation of emerging infectious diseases. Bioscience. 2020;70:531–4. DOIPubMedGoogle Scholar
- Dunnum JL, Yanagihara R, Johnson KM, Armien B, Batsaikhan N, Morgan L, et al. Biospecimen repositories and integrated databases as critical infrastructure for pathogen discovery and pathobiology research. PLoS Negl Trop Dis. 2017;11:
e0005133 . DOIPubMedGoogle Scholar - Thompson CW, Phelps KL, Allard MW, Cook JA, Dunnum JL, Ferguson AW, et al. Preserve a voucher specimen! The critical need for integrating natural history collections in infectious disease studies. MBio. 2021;12:e02698–20. DOIPubMedGoogle Scholar
- Soniat TJ, Sihaloho HF, Stevens RD, Little TD, Phillips CD, Bradley RD. Temporal-dependent effects of DNA degradation on frozen tissues archived at −80°C. J Mammal. 2021;102:375–83. DOIGoogle Scholar
- Yates TL, Mills JN, Parmenter CA, Ksiazek TG, Parmenter RR, Vande Castle JR, et al. The ecology and evolutionary history of an emergent disease: hantavirus pulmonary syndrome. Evidence from two El Niño episodes in the American southwest suggests that El Niño–driven precipitation, the initial catalyst of a trophic cascade that results in a delayed density-dependent rodent response, is sufficient to predict heightened risk for human contraction of hantavirus pulmonary syndrome. Bioscience. 2002;52:989–98. DOIGoogle Scholar
- Choi M, Scholl UI, Ji W, Liu T, Tikhonova IR, Zumbo P, et al. Genetic diagnosis by whole exome capture and massively parallel DNA sequencing. Proc Natl Acad Sci U S A. 2009;106:19096–101. DOIPubMedGoogle Scholar
- Yi X, Liang Y, Huerta-Sanchez E, Jin X, Cuo ZX, Pool JE, et al. Sequencing of 50 human exomes reveals adaptation to high altitude. Science. 2010;329:75–8. DOIPubMedGoogle Scholar
- McCormack JE, Hird SM, Zellmer AJ, Carstens BC, Brumfield RT. Applications of next-generation sequencing to phylogeography and phylogenetics. Mol Phylogenet Evol. 2013;66:526–38. DOIPubMedGoogle Scholar
- Vernot B, Zavala EI, Gómez-Olivencia A, Jacobs Z, Slon V, Mafessoni F, et al. Unearthing Neanderthal population history using nuclear and mitochondrial DNA from cave sediments. Science. 2021;372:eabf1667.
- Fu Q, Hajdinjak M, Moldovan OT, Constantin S, Mallick S, Skoglund P, et al. An early modern human from Romania with a recent Neanderthal ancestor. Nature. 2015;524:216–9. DOIPubMedGoogle Scholar
- Gaudin M, Desnues C. Hybrid capture-based next generation sequencing and its application to human infectious diseases. Front Microbiol. 2018;9:2924. DOIPubMedGoogle Scholar
- Keller M, Spyrou MA, Scheib CL, Neumann GU, Kröpelin A, Haas-Gebhard B, et al. Ancient Yersinia pestis genomes from across Western Europe reveal early diversification during the First Pandemic (541-750). Proc Natl Acad Sci U S A. 2019;116:12363–72. DOIPubMedGoogle Scholar
- Lee JS, Mackie RS, Harrison T, Shariat B, Kind T, Kehl T, et al. Targeted enrichment for pathogen detection and characterization in three felid species. J Clin Microbiol. 2017;55:1658–70. DOIPubMedGoogle Scholar
- Wylie TN, Wylie KM, Herter BN, Storch GA. Enhanced virome sequencing using targeted sequence capture. Genome Res. 2015;25:1910–20. DOIPubMedGoogle Scholar
- O’Flaherty BM, Li Y, Tao Y, Paden CR, Queen K, Zhang J, et al. Comprehensive viral enrichment enables sensitive respiratory virus genomic identification and analysis by next generation sequencing. Genome Res. 2018;28:869–77. DOIPubMedGoogle Scholar
- Faircloth BC, McCormack JE, Crawford NG, Harvey MG, Brumfield RT, Glenn TC. Ultraconserved elements anchor thousands of genetic markers spanning multiple evolutionary timescales. Syst Biol. 2012;61:717–26. DOIPubMedGoogle Scholar
- Faircloth BC. Identifying conserved genomic elements and designing universal bait sets to enrich them. Methods Ecol Evol. 2017;8:1103–12. DOIGoogle Scholar
- Gotia HT, Munro JB, Knowles DP, Daubenberger CA, Bishop RP, Silva JC. Absolute quantification of the host-to-parasite DNA ratio in Theileria parva‒infected lymphocyte cell lines. PLoS One. 2016;11:
e0150401 . DOIPubMedGoogle Scholar - Cowell AN, Loy DE, Sundararaman SA, Valdivia H, Fisch K, Lescano AG, et al. Selective whole-genome amplification is a robust method that enables scalable whole-genome sequencing of from unprocessed clinical samples. MBio. 2017;8:e02257–16. DOIPubMedGoogle Scholar
- Bushnell B. BBMap: a fast, accurate, splice-aware aligner. Berkeley (CA): Lawrence Berkeley National Laboratory; 2014.
- Wood DE, Lu J, Langmead B. Improved metagenomic analysis with Kraken 2. Genome Biol. 2019;20:257. DOIPubMedGoogle Scholar
- Bankevich A, Nurk S, Antipov D, Gurevich AA, Dvorkin M, Kulikov AS, et al. SPAdes: a new genome assembly algorithm and its applications to single-cell sequencing. J Comput Biol. 2012;19:455–77. DOIPubMedGoogle Scholar
- Kozlov AM, Darriba D, Flouri T, Morel B, Stamatakis A. RAxML-NG: a fast, scalable and user-friendly tool for maximum likelihood phylogenetic inference. Bioinformatics. 2019;35:4453–5. DOIPubMedGoogle Scholar
- Jacomo V, Kelly PJ, Raoult D. Natural history of Bartonella infections (an exception to Koch’s postulate). Clin Diagn Lab Immunol. 2002;9:8–18.PubMedGoogle Scholar
- Chomel BB, Boulouis HJ, Maruyama S, Breitschwerdt EB. Bartonella spp. in pets and effect on human health. Emerg Infect Dis. 2006;12:389–94. DOIPubMedGoogle Scholar
- Dahmani M, Diatta G, Labas N, Diop A, Bassene H, Raoult D, et al. Noncontiguous finished genome sequence and description of Bartonella mastomydis sp. nov. New Microbes New Infect. 2018;25:60–70. DOIPubMedGoogle Scholar
- Briese T, Kapoor A, Mishra N, Jain K, Kumar A, Jabado OJ, et al. Virome capture sequencing enables sensitive viral diagnosis and comprehensive virome analysis. mBio. 2015;6:e01491–15. DOIPubMedGoogle Scholar
- Gerrits GP, Klaassen C, Coenye T, Vandamme P, Meis JF. Burkholderia fungorum septicemia. Emerg Infect Dis. 2005;11:1115–7. DOIPubMedGoogle Scholar
- Vandamme P, Peeters C. Time to revisit polyphasic taxonomy. Antonie van Leeuwenhoek. 2014;106:57–65. DOIPubMedGoogle Scholar
- Angus AA, Agapakis CM, Fong S, Yerrapragada S, Estrada-de los Santos P, Yang P, et al. Plant-associated symbiotic Burkholderia species lack hallmark strategies required in mammalian pathogenesis. PLoS One. 2014;9:
e83779 . DOIPubMedGoogle Scholar - Salter SJ, Cox MJ, Turek EM, Calus ST, Cookson WO, Moffatt MF, et al. Reagent and laboratory contamination can critically impact sequence-based microbiome analyses. BMC Biol. 2014;12:87. DOIPubMedGoogle Scholar
- Chen YY, Huang WT, Chen CP, Sun SM, Kuo FM, Chan YJ, et al. An outbreak of Ralstonia pickettii bloodstream infection associated with an intrinsically contaminated normal saline solution. Infect Control Hosp Epidemiol. 2017;38:444–8. DOIPubMedGoogle Scholar
- Bi K, Vanderpool D, Singhal S, Linderoth T, Moritz C, Good JM. Transcriptome-based exon capture enables highly cost-effective comparative genomic data collection at moderate evolutionary scales. BMC Genomics. 2012;13:403. DOIPubMedGoogle Scholar
- Weber JL. Analysis of sequences from the extremely A + T-rich genome of Plasmodium falciparum. Gene. 1987;52:103–9. DOIPubMedGoogle Scholar
- Tourlousse DM, Narita K, Miura T, Ohashi A, Matsuda M, Ohyama Y, et al. Characterization and demonstration of mock communities as control reagents for accurate human microbiome community measurements. Microbiol Spectr. 2022;10:
e0191521 . DOIPubMedGoogle Scholar - Bennuru S, O’Connell EM, Drame PM, Nutman TB. Mining filarial genomes for diagnostic and therapeutic targets. Trends Parasitol. 2018;34:80–90. DOIPubMedGoogle Scholar
Figures
Tables
Cite This ArticleOriginal Publication Date: June 26, 2023
Table of Contents – Volume 29, Number 8—August 2023
| EID Search Options |
|---|
|
|
|
|
|
|
Please use the form below to submit correspondence to the authors or contact them at the following address:
Roy N. Platt, Texas Biomedical Research Institute, 8715 W Military Dr, San Antonio, TX 78245-0549, USA
Top