Skip directly to site content Skip directly to page options Skip directly to A-Z link Skip directly to A-Z link Skip directly to A-Z link
Volume 29, Number 8—August 2023
Research

Waterborne Infectious Diseases Associated with Exposure to Tropical Cyclonic Storms, United States, 1996–2018

Victoria D. LynchComments to Author  and Jeffrey Shaman
Author affiliation: Columbia University, New York, New York, USA

Main Article

Figure 1

Average weekly cases by geographic region in a study of waterborne infectious diseases associated with exposure to tropical cyclonic storms, United States, 1996–2018. Graphs indicate weekly number of cases per 1,000,000 populations for the following waterborne diseases: A) cryptosporidiosis; B) giardiasis; C) Legionnaires’ disease; D) Escherichia coli infection; E) salmonellosis; and F) shigellosis. Not all infections were reported for the entire study period (Table 1). The shaded region represents the weeks encompassed in the annual Atlantic storm season, June 1–November 30. The geographic regions reflect the reporting areas used for infectious disease surveillance in the National Notifiable Diseases Surveillance System (https://www.cdc.gov/nndss). The New England region comprises the states of Connecticut, Maine, Massachusetts, New Hampshire, Rhode Island, and Vermont; the Mid-Atlantic Region comprises New Jersey, New York, and Pennsylvania; the South-Atlantic Region comprises Delaware, Florida, Georgia, Maryland, North Carolina, South Carolina, Virginia, West Virginia, and Washington, DC; the East-North Central Region comprises Illinois, Indiana, Michigan, Ohio, and Wisconsin; the East-South Central Region comprises Alabama, Kentucky, Mississippi, and Tennessee; and the West-South Central Region comprises Arkansas, Louisiana, Oklahoma, and Texas.

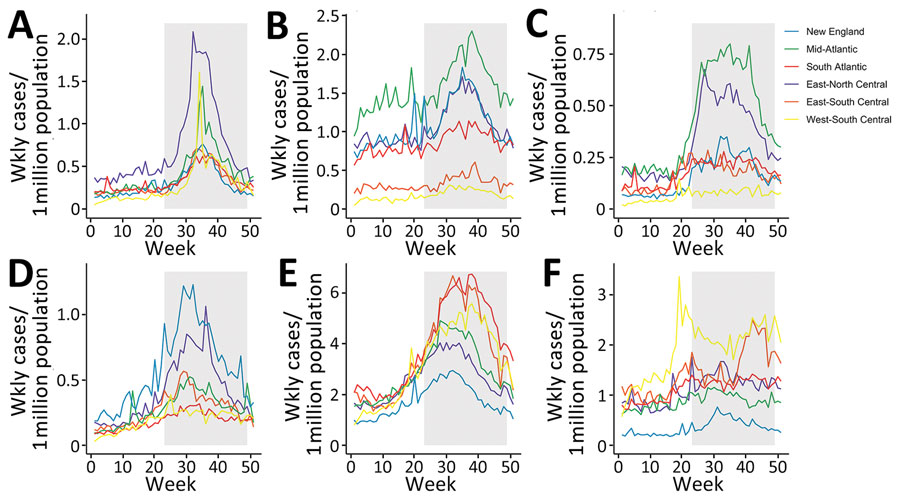
Figure 1. Average weekly cases by geographic region in a study of waterborne infectious diseases associated with exposure to tropical cyclonic storms, United States, 1996–2018. Graphs indicate weekly number of cases per 1,000,000 populations for the following waterborne diseases: A) cryptosporidiosis; B) giardiasis; C) Legionnaires’ disease; D) Escherichia coli infection; E) salmonellosis; and F) shigellosis. Not all infections were reported for the entire study period (Table 1). The shaded region represents the weeks encompassed in the annual Atlantic storm season, June 1–November 30. The geographic regions reflect the reporting areas used for infectious disease surveillance in the National Notifiable Diseases Surveillance System (https://www.cdc.gov/nndss). The New England region comprises the states of Connecticut, Maine, Massachusetts, New Hampshire, Rhode Island, and Vermont; the Mid-Atlantic Region comprises New Jersey, New York, and Pennsylvania; the South-Atlantic Region comprises Delaware, Florida, Georgia, Maryland, North Carolina, South Carolina, Virginia, West Virginia, and Washington, DC; the East-North Central Region comprises Illinois, Indiana, Michigan, Ohio, and Wisconsin; the East-South Central Region comprises Alabama, Kentucky, Mississippi, and Tennessee; and the West-South Central Region comprises Arkansas, Louisiana, Oklahoma, and Texas.

Main Article

Page created: May 24, 2023
Page updated: July 20, 2023
Page reviewed: July 20, 2023
The conclusions, findings, and opinions expressed by authors contributing to this journal do not necessarily reflect the official position of the U.S. Department of Health and Human Services, the Public Health Service, the Centers for Disease Control and Prevention, or the authors' affiliated institutions. Use of trade names is for identification only and does not imply endorsement by any of the groups named above.
file_external