Volume 29, Number 8—August 2023
Research
Waterborne Infectious Diseases Associated with Exposure to Tropical Cyclonic Storms, United States, 1996–2018
Victoria D. Lynch and Jeffrey Shaman
Figure 3
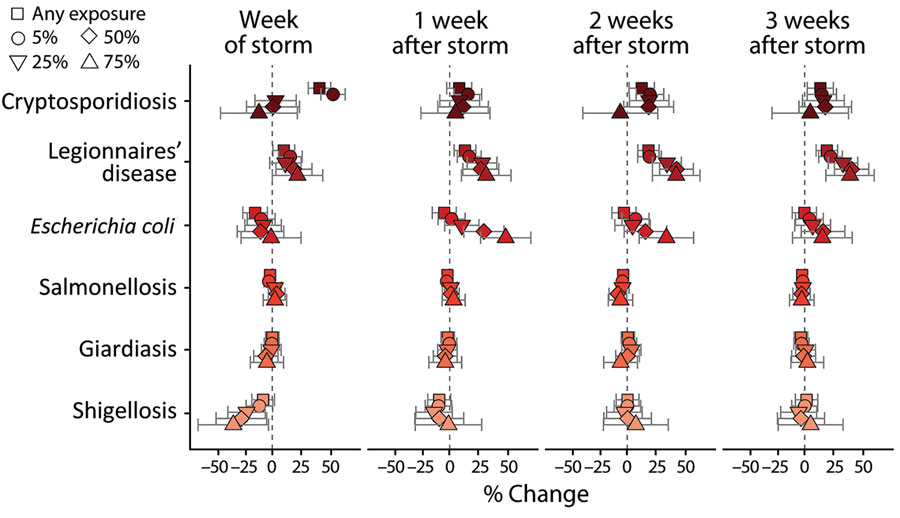
Figure 3. Average percent change in weekly case rates in a study of waterborne infectious diseases associated with exposure to tropical cyclonic storms, United States, 1966–2018. Estimated percentage change (shapes) and Bonferroni-corrected 95% CI (bars) are reported for each infectious disease and population-exposure threshold. Estimates are reported for week of the storm (week 0) and 1–3 weeks after the storm and are associated with exposure to >75 mm of storm-related rainfall.
Page created: May 24, 2023
Page updated: July 20, 2023
Page reviewed: July 20, 2023
The conclusions, findings, and opinions expressed by authors contributing to this journal do not necessarily reflect the official position of the U.S. Department of Health and Human Services, the Public Health Service, the Centers for Disease Control and Prevention, or the authors' affiliated institutions. Use of trade names is for identification only and does not imply endorsement by any of the groups named above.