Volume 30, Number 2—February 2024
Research
Multiple Introductions of Yersinia pestis during Urban Pneumonic Plague Epidemic, Madagascar, 2017
Voahangy Andrianaivoarimanana1, Cyril Savin1, Dawn N. Birdsell1, Amy J. Vogler, Anne-Sophie Le Guern, Soloandry Rahajandraibe, Sylvie Brémont, Soanandrasana Rahelinirina, Jason W. Sahl, Beza Ramasindrazana, Rado Jean Luc Rakotonanahary, Fanjasoa Rakotomanana, Rindra Randremanana, Viviane Maheriniaina, Vaoary Razafimbia, Aurelia Kwasiborski, Charlotte Balière, Maherisoa Ratsitorahina, Laurence Baril, Paul Keim, Valérie Caro, Voahangy Rasolofo, André Spiegel, Javier Pizarro-Cerda2, David M. Wagner2, and Minoarisoa Rajerison2
Figure 3
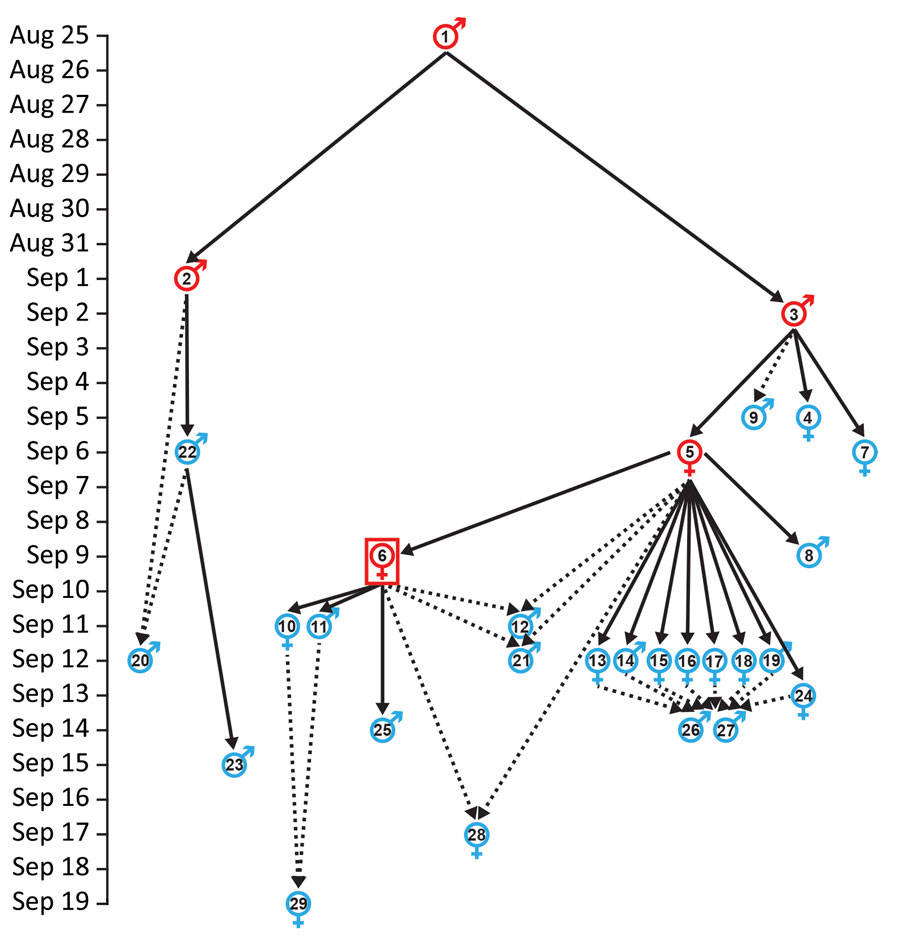
Figure 3. Transmission patterns among the initial 29 cases associated with the first urban PP transmission chain in Madagascar, August–November 2017 (emergence 2 in Table 1). Dates are illness onset dates. Solid arrows indicate likely infection sources based on known contact (Table 2); dotted arrows indicate hypothetical infection sources inferred from genetic data, epidemiologic data, or both. Symbols for individual cases indicate male or female sex; red indicates persons who died and blue indicates survivors. Red box indicates the first identified case from the epidemic that triggered the subsequent public health response.
1These authors contributed equally to this article.
2These senior authors contributed equally to this article.
Page created: December 31, 2023
Page updated: January 24, 2024
Page reviewed: January 24, 2024
The conclusions, findings, and opinions expressed by authors contributing to this journal do not necessarily reflect the official position of the U.S. Department of Health and Human Services, the Public Health Service, the Centers for Disease Control and Prevention, or the authors' affiliated institutions. Use of trade names is for identification only and does not imply endorsement by any of the groups named above.