Volume 6, Number 3—June 2000
Research
Using Remotely Sensed Data To Identify Areas at Risk for Hantavirus Pulmonary Syndrome
Gregory E. Glass* , James E. Cheek†, Jonathan A. Patz*, Timothy M. Shields*, Timothy J. Doyle‡, Douglas A. Thoroughman†, Darcy K. Hunt†, Russell E. Enscore§, Kenneth L. Gage§, Charles Irland†, C. J. Peters¶, and Ralph Bryan§
Figure 1
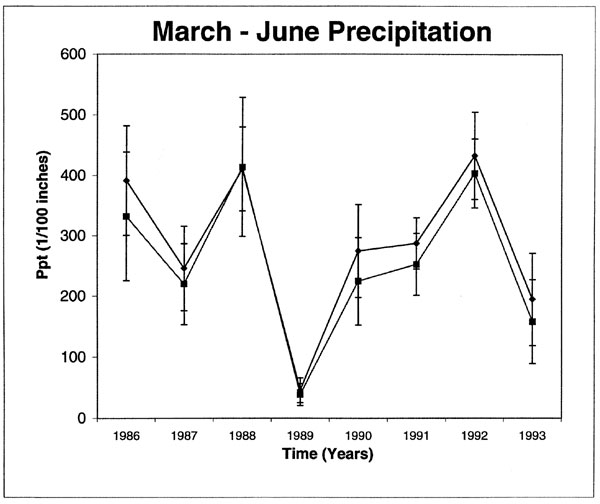
Figure 1. March-June precipitation patterns at case sites (solid symbols) and control sites (open symbols) from 1986 through 1993. Vertical bars are 1 standard deviation in precipitation values.
Page created: December 16, 2010
Page updated: December 16, 2010
Page reviewed: December 16, 2010
The conclusions, findings, and opinions expressed by authors contributing to this journal do not necessarily reflect the official position of the U.S. Department of Health and Human Services, the Public Health Service, the Centers for Disease Control and Prevention, or the authors' affiliated institutions. Use of trade names is for identification only and does not imply endorsement by any of the groups named above.