Volume 9, Number 2—February 2003
Research
Annual Mycobacterium tuberculosis Infection Risk and Interpretation of Clustering Statistics
Emilia Vynnycky* , Martien W. Borgdorff†, Dick van Soolingen‡, and Paul E.M. Fine*
Figure 4
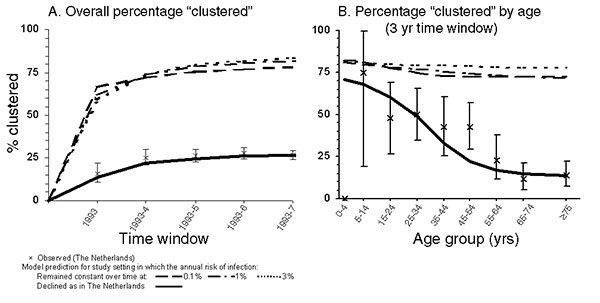
Figure 4. Model predictions of A) the overall percentage of cases clustered during different time periods from 1993 to 1997 and B) the age-specific percentage of (male) cases clustered during the period 1993–1995 in the Netherlands and in settings in which the annual risk for infection has remained unchanged over time at 0.1%, 1%, and 3%. The clustering observed in the Netherlands, after excluding clusters involving immigrants, is also shown.
Page created: June 08, 2011
Page updated: June 08, 2011
Page reviewed: June 08, 2011
The conclusions, findings, and opinions expressed by authors contributing to this journal do not necessarily reflect the official position of the U.S. Department of Health and Human Services, the Public Health Service, the Centers for Disease Control and Prevention, or the authors' affiliated institutions. Use of trade names is for identification only and does not imply endorsement by any of the groups named above.