Volume 22, Number 12—December 2016
Research
African Horse Sickness Caused by Genome Reassortment and Reversion to Virulence of Live, Attenuated Vaccine Viruses, South Africa, 2004–2014
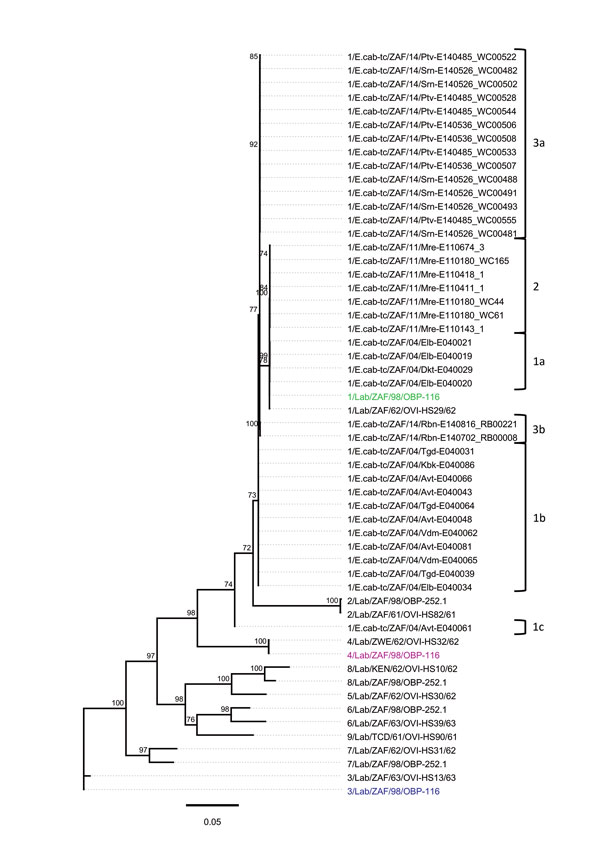
Figure 2

Figure 2. Whole-genome phylogeny of African horse sickness (AHS) viruses identified in AHS outbreaks in Western Cape Province, South Africa, 2004–2014. Maximum-likelihood phylogenetic tree indicating the genetic relationships of concatenated whole genome nucleotide sequences of AHS viruses from affected horses in the 2004, 2011, and 2014 outbreaks in the AHS controlled area in Western Cape Province to the AHS live, attenuated vaccine viruses and reference viruses. Branches are scaled to represent numbers of inferred nucleotide differences per site. Branches supported by full maximum-likelihood bootstrap values >70% are indicated. Genotype groups are indicated at right. Scale bar indicates genetic distance.
Page created: November 17, 2016
Page updated: November 17, 2016
Page reviewed: November 17, 2016
The conclusions, findings, and opinions expressed by authors contributing to this journal do not necessarily reflect the official position of the U.S. Department of Health and Human Services, the Public Health Service, the Centers for Disease Control and Prevention, or the authors' affiliated institutions. Use of trade names is for identification only and does not imply endorsement by any of the groups named above.