Volume 24, Number 12—December 2018
Research
Terrestrial Bird Migration and West Nile Virus Circulation, United States
Daniele Swetnam, Steven G. Widen, Thomas G. Wood, Martin Reyna, Lauren Wilkerson, Mustapha Debboun, Dreda A. Symonds, Daniel G. Mead, Barry J. Beaty, Hilda Guzman, Robert B. Tesh, and Alan D.T. Barrett
Figure 2
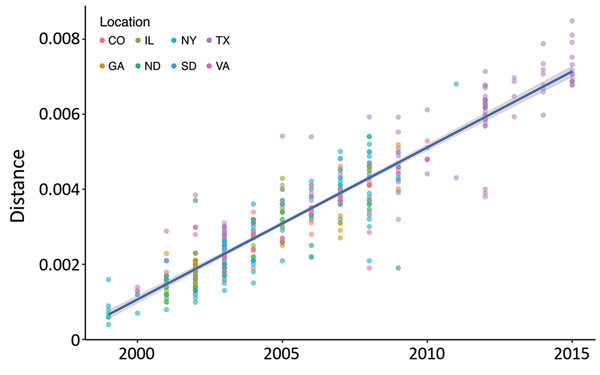
Figure 2. Analysis of correlation between virus isolation date and genetic diversity in study of terrestrial bird migration and West Nile virus circulation, United States. Root-to-tip distances of all sequences were determined for each isolate by using the maximum-likelihood tree shown in Figure 1 (https://wwwnc.cdc.gov/EID/article/24/12/18-0382-F1.htm) and plotted against the year. Dots are colored by location of isolation. The correlation between the root-to-tip distance and year of isolation was determined with linear regression shown in blue. 95% CIs are shown in gray. The equation of the linear regression line was used to estimate the year of the most recent common ancestor (MRCA) and the mutation rate (m): y = mx + MRCA.
Page created: November 20, 2018
Page updated: November 20, 2018
Page reviewed: November 20, 2018
The conclusions, findings, and opinions expressed by authors contributing to this journal do not necessarily reflect the official position of the U.S. Department of Health and Human Services, the Public Health Service, the Centers for Disease Control and Prevention, or the authors' affiliated institutions. Use of trade names is for identification only and does not imply endorsement by any of the groups named above.