Volume 25, Number 4—April 2019
Research
Differences in Neuropathogenesis of Encephalitic California Serogroup Viruses
Figure 3
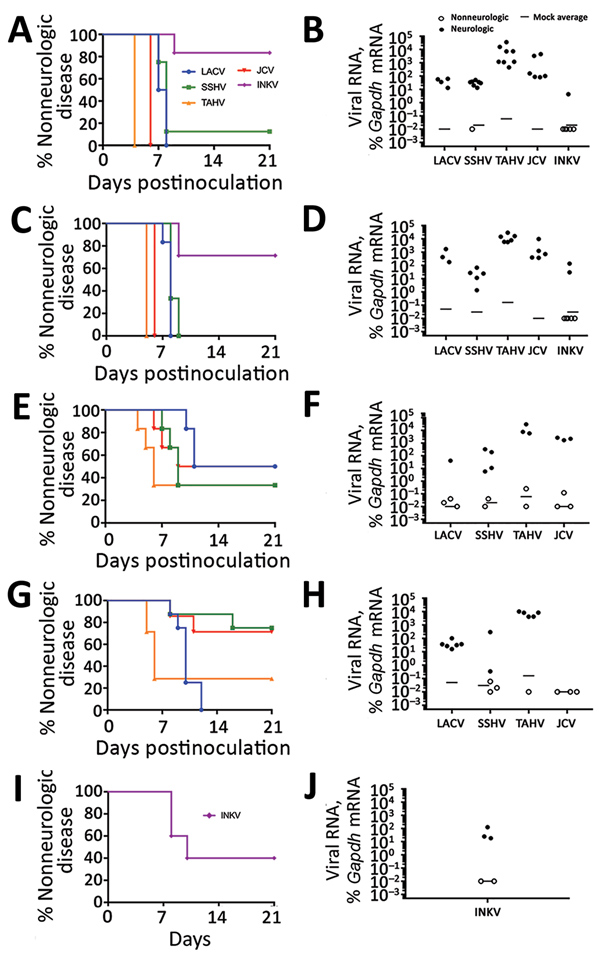
Figure 3. Neurovirulence of California serogroup (CSG) viruses in adult, aged, and weanling mice after intranasal inoculation in study of neuropathogenesis of encephalitic CSG viruses. Groups of adult (A, B) and aged (C, D) mice (6–8 mice per group) were inoculated with 104 PFU of each virus; groups of adult (E, F) and aged (G, H) mice (6–8 mice per group) were inoculated with 102 PFU of LACV, SSHV, TAHV, and JCV; and 5 weanling mice were inoculated with 104 PFU of INKV (I, J). E, G) Survival rate differences between adult and aged mice infected with 102 PFU of virus were calculated for each virus by using the Gehan-Breslow-Wilcoxon test. LACV was the only virus with a significant difference (p = 0.035). B, D, F, H, J) Viral RNA in mouse brains was analyzed by quantitative reverse transcription PCR with virus-specific primers. The average of 3 mock controls is reported for each primer set. The viral RNA level in each sample was calculated as the difference in the percentage in cycle threshold (Ct): Ct for Gapdh mRNA minus Ct for viral mRNA. Viral RNA was plotted as the percentage of gene expression relative to that of the Gapdh gene. Gapdh, glyceraldehyde 3-phosphate dehydrogenase; INKV, Inkoo virus; JCV, Jamestown Canyon virus; LACV, La Crosse virus; SSHV, snowshoe hare virus; TAHV, Tahyna virus.