Volume 27, Number 1—January 2021
Research
Differential Yellow Fever Susceptibility in New World Nonhuman Primates, Comparison with Humans, and Implications for Surveillance
Natália C.C. de Azevedo Fernandes , Juliana M. Guerra, Josué Díaz-Delgado, Mariana S. Cunha, Leila delC. Saad, Silvia D. Iglezias, Rodrigo A. Ressio, Cinthya dos Santos Cirqueira, Cristina T. Kanamura, Isis P. Jesus, Adriana Y. Maeda, Fernanda G.S. Vasami, Júlia de Carvalho, Leonardo J.T. de Araújo, Renato Pereira de Souza, Juliana S. Nogueira, Roberta M.F. Spinola, and José L. Catão-Dias
Figure 3
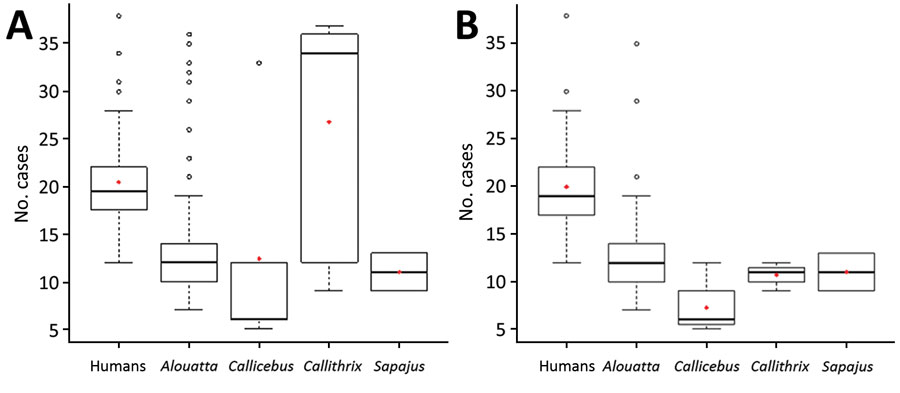
Figure 3. Distribution of Cq values for yellow fever for concordant and discordant cases (A) and cases in different New World primates and in humans (B), Brazil. Box plots indicate Cq values among the groups, indicated by the y-axes, minimum, first quartile, third quartile, and maximum Cq values. Horizontal bars indicate medians. Circles indicate outlier Cq values, and red diamonds indicate mean Cq values. Concordance was determined by using immunohistochemical analysis (lesions and viral antigen in hepatocytes).
Page created: October 05, 2020
Page updated: December 21, 2020
Page reviewed: December 21, 2020
The conclusions, findings, and opinions expressed by authors contributing to this journal do not necessarily reflect the official position of the U.S. Department of Health and Human Services, the Public Health Service, the Centers for Disease Control and Prevention, or the authors' affiliated institutions. Use of trade names is for identification only and does not imply endorsement by any of the groups named above.