Prevalence and Clinical Profile of Severe Acute Respiratory Syndrome Coronavirus 2 Infection among Farmworkers, California, USA, June–November 2020
Joseph A. Lewnard
1
, Ana M. Mora
1, Oguchi Nkwocha, Katherine Kogut, Stephen A. Rauch, Norma Morga, Samantha Hernandez, Marcus P. Wong, Karen Huen, Kristin Andrejko, Nicholas P. Jewell, Kimberly L. Parra, Nina Holland, Eva Harris, Maximiliano Cuevas, Brenda Eskenazi, and
on behalf of the CHAMACOS-Project-19 Study Team2
Author affiliations: University of California, Berkeley, Berkeley, California, USA (J.A. Lewnard, A.M. Mora, K. Kogut, S.A. Rauch, S. Hernandez, M.P. Wong, K. Huen, K. Andrejko, N.P. Jewell, N. Holland, E. Harris, B. Eskenazi); Universidad Nacional, Heredia, Costa Rica (A.M. Mora); Clínica de Salud del Valle de Salinas, Salinas, California, USA (O. Nkwocha, N. Morga, M. Cuevas); London School of Hygiene and Tropical Medicine, London, UK (N.P. Jewell); University of Arizona, Tucson, Arizona, USA (K.L. Parra)
Main Article
Figure 1
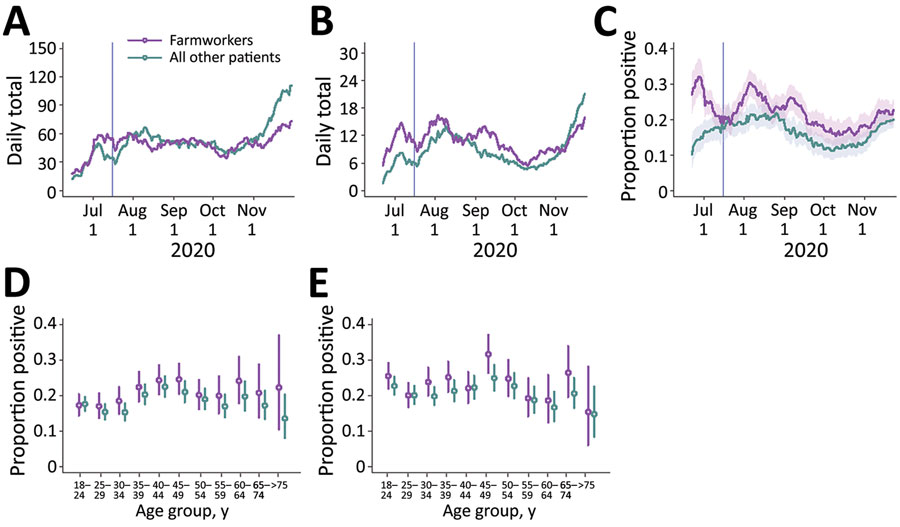
Figure 1. Cases of severe acute respiratory syndrome coronavirus 2 (SARS-CoV-2) diagnosed at Clínica de Salud del Valle de Salinas (CSVS), Monterey County, California, USA, June 15–November 30, 2020. We plotted the 2-week moving averages of the number of patients tested by CSVS (A); the number of SARS-CoV-2 infections diagnosed (B); and the proportion of tests yielding positive results (C). Shading indicates 95% CIs. Vertical lines indicate the date the cross-sectional study began, July 16. We also plotted age- and sex- stratified test-positive fractions for female (D) and male (E) patients. Bars indicate ranges; circles indicate medians.
Main Article
Page created: February 27, 2021
Page updated: April 20, 2021
Page reviewed: April 20, 2021
The conclusions, findings, and opinions expressed by authors contributing to this journal do not necessarily reflect the official position of the U.S. Department of Health and Human Services, the Public Health Service, the Centers for Disease Control and Prevention, or the authors' affiliated institutions. Use of trade names is for identification only and does not imply endorsement by any of the groups named above.