Transmission Dynamics of African Swine Fever Virus, South Korea, 2019
Dae Sung Yoo
1, Younjung Kim
1
, Eune Sub Lee, Jun Sik Lim, Seong Keun Hong, Il Seob Lee, Chung Sik Jung, Ha Chung Yoon, Sung Hwan Wee, Dirk U. Pfeiffer, and Guillaume Fournié
Author affiliations: Animal and Plant Quarantine Agency, Gimcheon, South Korea (D.S. Yoo, E.S. Lee, S.K. Hong, I.S. Lee, C.S. Jung, H.C. Yoon, S.H. Wee); Jockey Club College of Veterinary Medicine and Life Sciences, City University of Hong Kong, Hong Kong, China (Y. Kim, D.U. Pfeiffer); Kangwon National University College of Veterinary Medicine, Chuncheon, South Korea (J.S. Lim); Royal Veterinary College, London, UK (D.U. Pfeiffer, G. Fournié)
Main Article
Figure 5
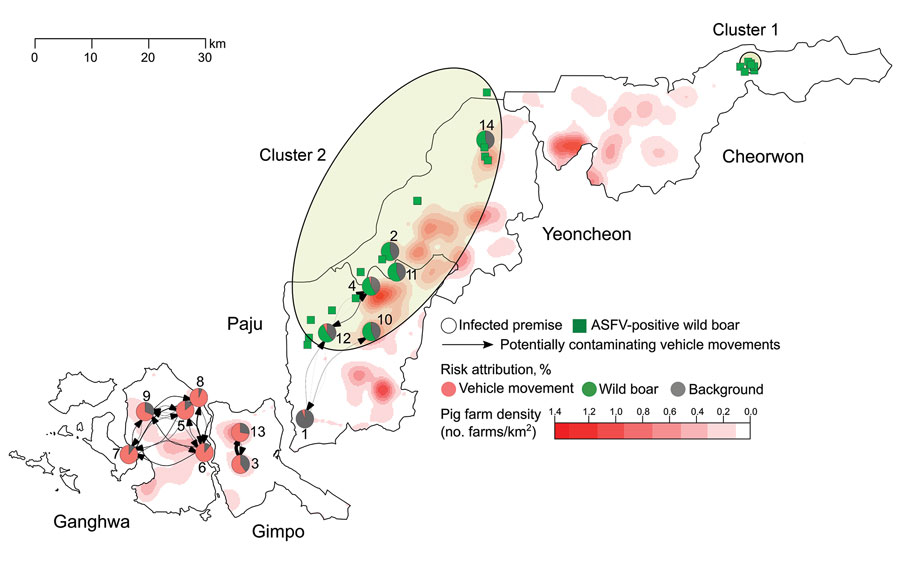
Figure 5. Spatial distribution of infected premises (IPs), non-IPs, African swine fever virus (ASFV)–positive wild boars, and potentially contaminating vehicle movements between IPs, South Korea, 2019. The duration of vehicle infectiousness was set to 3 days. Circles represent IPs; numbers represent the order of reporting dates. Pie charts show the estimated contribution of different transmission routes to the infection of each IP. Edge width is proportional to the number of potentially contaminating vehicle movements between IPs, weighted by the probability that an exit IP was infectious at the time of the vehicle departure. Edge arrows represent the direction of vehicle movements. Pig farm density is shown in reddish colors. Green squares represent the location of ASFV-positive wild boars; green-shaded ellipses represent spatial clusters.
Main Article
Page created: May 14, 2021
Page updated: June 16, 2021
Page reviewed: June 16, 2021
The conclusions, findings, and opinions expressed by authors contributing to this journal do not necessarily reflect the official position of the U.S. Department of Health and Human Services, the Public Health Service, the Centers for Disease Control and Prevention, or the authors' affiliated institutions. Use of trade names is for identification only and does not imply endorsement by any of the groups named above.