Volume 29, Number 1—January 2023
Research
Widespread Exposure to Mosquitoborne California Serogroup Viruses in Caribou, Arctic Fox, Red Fox, and Polar Bears, Canada
Abstract
Northern Canada is warming at 3 times the global rate. Thus, changing diversity and distribution of vectors and pathogens is an increasing health concern. California serogroup (CSG) viruses are mosquitoborne arboviruses; wildlife reservoirs in northern ecosystems have not been identified. We detected CSG virus antibodies in 63% (95% CI 58%–67%) of caribou (n = 517), 4% (95% CI 2%–7%) of Arctic foxes (n = 297), 12% (95% CI 6%–21%) of red foxes (n = 77), and 28% (95% CI 24%–33%) of polar bears (n = 377). Sex, age, and summer temperatures were positively associated with polar bear exposure; location, year, and ecotype were associated with caribou exposure. Exposure was highest in boreal caribou and increased from baseline in polar bears after warmer summers. CSG virus exposure of wildlife is linked to climate change in northern Canada and sustained surveillance could be used to measure human health risks.
Annual temperatures in the circumpolar Arctic are rising at 2–3 times the global average, reducing ecologic barriers for arthropod reproduction and fueling shifts in insect diversity and distribution (1,2). The northward advancement of the tree line and a 50%–60% increase in Arctic precipitation over the past 20 years provide a favorable environment for arthropod emergence (3,4). Consequently, arboviruses are a growing wildlife and public health concern in the Arctic. Limited information exists on the diversity of arboviruses in Arctic ecosystems, and few studies have identified hosts in sylvatic transmission cycles.
California serogroup (CSG) viruses are antigenically and genetically related emerging vectorborne pathogens of the genus Orthobunyavirus that are found throughout North America and are associated with febrile illness and cases of neuroinvasive disease in humans (5). Pathogenic strains include La Crosse, Jamestown Canyon (JCV), California encephalitis, snowshoe hare (SSHV), Chatanga, and Inkoo viruses (6). Both JCV and SSHV have been identified as causes of arbovirus-associated neurologic diseases in North America (7). CSG viruses are transmitted through mosquitoes (Aedes, Culiseta, and Anopheles spp.), maintained by transovarial vector transmission, and circulate in a wide range of vertebrate hosts (5,8). Since 2006, documented human exposure to CSG viruses has steadily increased in Canada as serologic tests have become available, although infections are still likely underdiagnosed (5).
Studies on CSG virus ecology and epidemiology have primarily focused on southern Canada and the contiguous United States. However, recent cases of human exposure in Alaska and the province of Manitoba, Canada have been reported (9,10), indicating that those viruses exist in northern ecosystems. Human encephalitis in Canada, while rare, has generally been linked to JCV and SSHV serotypes (5). Furthermore, we recently detected JCV and SSHV in Aedes sp. mosquitoes and biting midges collected in northern Québec (11), further confirming circulation of CSG viruses in northern vectors. Potential reservoirs in southern Canada and the United States are cervids for JCV and rodents and lagomorphs for SSHV (5). We assessed potential reservoir and sentinel hosts in northern Canada by surveying caribou, rodents and shrews, and carnivores for CSG virus antibodies or RNA across a broad geographic range and identified biologic and ecologic factors associated with exposure.
Study Area
Figure
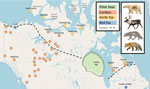
Figure. Distribution of animals in study of widespread exposure to mosquitoborne California serogroup viruses in caribou, Arctic fox, red fox, and polar bears, Canada. The green region is the mean on-ice...
We collected samples in Yukon, Northwest Territories (NT), Nunavut, Quebec, Manitoba, and British Columbia (BC), Canada (Figure). The study areas comprised tundra, boreal, and mountain ecosystems.
Sample Collection
We collected blood from hunter-harvested migratory tundra and boreal caribou (Rangifer tarandus) in Nunavik (2018, Tasiujaq and Umiujaq, n = 53) and Nunavut (2016, Bathurst Inlet, n = 19). We collected serum samples from caribou live-captured for radio collaring in Yukon (2017–2019, n = 152), BC (2018–2019, n = 20), NT (2010–2019, n = 219) and Nunavut (2019, Kugluktuk, n = 10; 2018, Bathurst Inlet, n = 44) (Figure). We determined sex but not age for caribou.
We collected blood from Arctic and red fox carcasses harvested for fur by licensed trappers in the NT (2018–2019, Inuvik, Sachs Harbour, and Ulukhaktok, n = 72), Nunavut (2019–2021, Cambridge Bay and Gjoa Haven, n = 85), Nunavik (2019–2021, Inukjuak and Tasiujaq, n = 20), and southern Quebec (2016–2017, n = 61). We collected serum samples from Arctic foxes trapped alive at Karrak Lake, Nunavut (2014–2018, n = 108) and Cambridge Bay, Nunavut (2021, n = 28) (13). We determined sex of the animals and estimated ages according to a tooth condition index (14).
Serum samples were collected from live-captured adult polar bears (n = 377) as part of a long-term study of the western Hudson Bay population during 1986–1989, 1995–1998, and 2015–2017 (15,16). Sex was determined, and age was estimated by extracting a vestigial premolar tooth and counting cementum annuli (17,18).
We collected tissues (instead of blood because of their small size) from rodents and shrews lethally trapped on line transects in the NT during the summers of 2017, 2018, and 2019 (n = 496). We also collected samples at Karrak Lake, Nunavut, during the summers of 2018 and 2019 (n = 9).
Serology
We stored blood (from carcasses) and serum samples (from live captures) at –20°C until processing. Serologic methods were performed as previously described (19). In brief, we detected SSHV and JCV IgM in samples from foxes, caribou, and bears by using a competitive ELISA (cELISA). We measured optical densities at 450 nm, and samples with an inhibition value >30% were considered seropositive. Because this approach was originally developed for serum samples, we compared a positive caribou serum sample diluted in heart blood (1:2) and the same serum sample diluted in blocking buffer (1:2) to identify potential inhibitory effects of whole blood. The dilution in heart blood resulted in 15% loss of inhibition, indicating that whole blood likely underestimates IgM prevalence.
After performing cELISAs, we sent subsets of positive caribou (n = 18) and fox (n = 4) serum samples to the National Microbiology Laboratory in Winnipeg for plaque reduction neutralization tests (PRNTs) to determine exposures to different viruses within the serogroup (20). We only conducted differential testing of this subset of animals because of resource limitations arising from the SARS-CoV-2 pandemic. Samples were considered positive for CSG viruses if neutralizing antibody titers were >1:20. A 4-fold increase in titer was used to determine antibody specificity to a single CSG virus versus previous exposures to multiple viruses.
RNA Extraction and Reverse Transcription PCR for CSG Viruses
We stored tissues from rodents at –20°C until RNA was extracted from a pooled sample of liver, lung, spleen, and kidney for each animal by using the RNeasy Mini Kit (QIAGEN, https://www.qiagen.com). We performed real-time reverse transcription PCR on extracted RNA samples by using the primers CE-NC-F1 (5′-GTGTTTTATGATGTCGCATCA-3′) and CE-NC-R1(5′-CATATACCCTGCATCAGGATCAA-3′) for SSHV and CE-NC-F2 (5′-GTTTTCTATGATGATGCATCC-3′) and CE-NC-R2 (5′-CACAAACCCTGCATCTGGATCAA-3′) for JCV. The probe for both SSHV and JCV was CE-NC (Fam-CAGGTGCAAATGGA-MGB; Integrated DNA Technologies, https://www.idtdna.com). We performed PCR under the following conditions: 50°C for 5 min, 95° for 20 s, then 45 cycles of 95°C for 3 s and 60°C for 30 s. A 20 µL reaction mixture was used containing 5 µL TaqMan Fast Virus 1-Step Master Mix (Thermo Fisher Scientific, https://www.thermofisher.com), 9.4 µL H2O, 0.1 µl of each primer (100 µmol/L), 0.2 µL of probe (25 µmol/L), and 5 µL of template. Positive controls were gBlock gene fragments (Integrated DNA Technologies) from the small segment of SSHV and JCV isolates reported in GenBank (accession nos. MK352486.1 and MN135989.1).
Statistical Analysis
We calculated sample prevalence and 95% CIs by using EpiTools epidemiologic calculators (21). We used multiple linear regression to model seropositivity with fixed effect variables 1/0 (positive/negative) as the dependent variables and region, year, age, species, and sex as predictor variables for fox data. We also used multiple linear regression to predict seropositivity (1/0) according to region, year, ecotype, and sex (but not age) for caribou. We classified regions as provinces or territories (BC, Yukon, NT, Nunavut, and Quebec) and ecotypes as migratory tundra, mountain, and boreal. The Leaf River caribou herd in Quebec was classified as migratory tundra caribou during this study, although they are often grouped as woodland forest-tundra caribou.
We also examined co-exposures to CSG viruses and 7 pathogens previously documented in the same polar bears (18) by using Pearson χ2 tests. Because of the long timeline for polar bear sample collection, we related seroprevalence (1/0) in polar bears to biologic and climatic factors (Table 1) by using binomial (logit link function) generalized linear mixed models and the same constrained set of a priori models for each pathogen as described previously (18). In brief, we evaluated sets of biologic and climatic variables separately and identified top factors by using Akaike information criterion corrected for small sample size and weight of the model >0.60. To assess the comparative influence of biologic and climatic factors on CSG virus exposure, we combined top biologic and climatic factors into 1 model and used log-likelihood ratio tests to examine model improvement (reported as χ2).
We performed analyses by using SPSS Statistics 28 (IBM, https://www.ibm.com) for caribou and foxes and R software version 3.3.3 (The R Project for Statistical Computing, https://www.r-project.org) for polar bears. We reported all variances with 95% CIs, and α was set to 0.05 for significance. We considered all animals sampled multiple times during the study (bears, n = 40; Arctic foxes, n = 12; Caribou; n = 52) positive if a single blood sample tested positive. We did not include subsequent results from positive animals in the analyses because duration of virus antibody production is not well understood.
Prevalence
Mean seroprevalence was 63% (95% CI 58%–67%, n = 517) for caribou, 4% (95% CI 2%–7%, n = 297) for Arctic foxes, 12% (95% CI 6%–21%, n = 77) for red foxes, and 28% (95% CI 24%–33%, n = 377) for polar bears (Table 2). The prevalence for bears varied significantly between time periods (χ2 = 9.98, degrees of freedom [d.f.] = 2, p = 0.007); a significant increase in positive cases was observed between the mid-1980s and mid-1990s (χ2 = 9.78, d.f. = 1, p = 0.002). Seropositivity in the mid-2010s did not significantly differ from either the mid-1980s (χ2 = 1.55, d.f. = 1, p = 0.213) or mid-1990s (χ2 = 2.71, d.f. = 1, p = 0.100) (Table 3). Polar bears sampled repeatedly (3 during 1995–1998 and 2 during 2015–2017) had positive titers that decreased below the cELISA threshold in subsequent sampling. Three of those bears were sampled again 1 year after initial positive samples, indicating that virus antibodies were short-lived (inhibition values were 38%, 45%, and 94% the year before). The other 2 bears were sampled 18–19 years after initial positive samples.
Estimated seroprevalence varied between regions for caribou and foxes; the highest prevalence was observed in the NT (83%, n = 219) and Nunavut (80%, n = 73) for caribou and in Nunavik for red foxes (20%, n = 10) and Arctic foxes (30%, n = 10) (Table 2). Boreal caribou (87%, n = 172) were exposed more often than migratory tundra (48%; n = 243) or mountain caribou (59%, n = 87) (Table 4). By PRNT, 18 positive cELISA samples from caribou in the NT had a positive titer >1:20 for JCV. We observed an SSHV titer of 1:40 in 4 caribou, 2 of which had a JCV titer of 1:160 and 1:320, indicating exposure to JCV. Furthermore, PRNT of 4 positive fox samples (3 from Nunavut and 1 from Quebec) indicated exposure to JCV.
Of the caribou that were repeatedly sampled during 2016–2018 (n = 52), 3 animals had titers that dropped below the cELISA cutoff value between winter and the following spring. Conversely, 3 animals seroconverted during the same time frame (inhibition values between 31%–43%). We did not detect viral RNA by PCR in samples from 349 red backed voles (Myodes rutilus), 20 meadow voles (Microtus pennsylvanicus), 68 deer mice (Peromyscus maniculatus), 9 collared lemmings (Dicrostonyx groenlandicus), and 59 shrews (species unidentified).
Biologic, Ecologic, and Climatic Factors
We did not detect substantial co-occurrence between CSG viruses and 7 other pathogens previously examined in the same polar bears (18). Both biologic and climatic factors influenced polar bear exposure to CSG viruses. Adult female polar bears were 2.6 (95% CI 1.6–4.2) times more likely to be seropositive than adult male polar bears. Age was negatively correlated with seropositivity, although the 95% CI included zero (β = −0.04, 95% CI –0.04 to 0.0). Polar bears previously captured in the town of Churchill, Manitoba, were 3.4 (95% CI 1.8–6.4) times less likely to be seropositive for CSG viruses. Summer temperature in the preceding year (corrected Akaike information criterion, weight of model = 0.97) was a top climatic factor in the model, and warmer summer air temperatures were positively correlated with polar bear exposure to CSG viruses (β = 0.78, 95% CI 0.47–1.09). Inclusion of biologic and climatic factors in the same model significantly improved model fit (χ2 = 29.0, d.f. = 3, p<0.001) (Appendix Table 1).
Biologic factors did not influence fox exposure to CSG viruses; however, location was significantly associated with seroprevalence (β = −0.2, p<0.05) and was highest in foxes in the eastern Arctic (R2 = 0.06, d.f. = 5, p<0.05). For caribou, location was also significantly associated with exposure (β = −0.6, p<0.001); the highest prevalence was observed in Nunavut and NT. In addition, ecotype (β = 0.3, p<0.001) and year (β = −0.2, p<0.001) were significant variables in the model (R2 = 0.22, d.f. = 4, p<0.001); the highest exposures occurred in 2010 (94%) and 2012 (93%) in the boreal woodland ecotype (Table 4).
This study demonstrates widespread exposure to mosquitoborne viruses in wildlife across northern Canada. Caribou were most often exposed to CSG viruses (likely JCV) with seroprevalence >80% in the NT and Nunavut. The high prevalence, along with identification of cervids as reservoir hosts in temperate regions, suggests that caribou might serve as reservoirs and sentinels for JCV (27). Caribou congregate in herds and are particularly vulnerable to arthropod bites during calving when they are sedentary (28). Thus, we expected higher rates of CSG virus exposure in caribou than in polar bears that spend a considerable amount of time on sea ice or foxes that have a smaller body size and are nocturnally active (29,30). Sampling location (province/territory) was associated with exposure, and high seroprevalence in caribou in central and western Arctic regions contrasted with 13% seroprevalence in the eastern Arctic (Nunavik, Quebec). This result reflects a difference in virus prevalence, although the use of whole blood from harvested animals in the eastern Arctic likely underestimated seroprevalence, especially in the migratory tundra ecotype. Noticeable differences in prevalence were also observed between whole blood and serum samples from caribou in Nunavut (Table 2), indicating that whole blood is likely not an ideal sample for the cELISA.
Canada’s changing climate might play a role in CSG virus seroprevalence. The western Arctic region in Canada is warming more rapidly than the eastern Arctic region of Canada and the rest of the world (2). Warming temperatures have been linked to changes in mosquito diversity, density, distribution, and host-seeking behaviors (31,32). For example, rising temperatures can increase mosquito development and survival and bring mosquitoes into phenologic synchrony with caribou, providing opportunities for pathogen transmission (31). Increases in precipitation might also influence regional differences in vector abundance and competence. Normalized precipitation increased 30% from 1948 to 2012 in the Arctic region of Canada (33), especially in Nunavut, thereby increasing the abundance of larval development sites for mosquito vectors (2,34). Sampling year also influenced caribou exposure. Therefore, future long-term studies should investigate associations between climate and temporal patterns of exposure in caribou, as we did for polar bears.
Ecotype was the final factor that was associated with caribou exposure. Boreal caribou had greater exposure than those in other ecotypes (87%; Table 4). Boreal caribou remain in treed environments year-round, whereas tundra and mountain caribou migrate to tundra and alpine habitats during the summer months (35,36). Warmer temperatures at lower altitudes and lower windspeeds in treed environments might increase exposure to insect bites (37). Climate change has been linked to the northward advancement of the tree line, which might increase exposure to CSG viruses for caribou populations in the future (4). These factors, along with differences in the distribution and diversity of mosquito species and their vector competence, might all contribute to observed variations in seroprevalence among caribou and might also correlate with risk for human exposure.
In foxes, overall CSG virus seroprevalence was much lower than for caribou, likely because of lower exposure to mosquitoes (smaller body size, nocturnal activity) (30). Region was associated with exposure in foxes. However, contrary to the results from caribou, the highest seroprevalence for foxes was in northern Quebec (30% for Arctic fox and 20% for red fox). This result might reflect a difference in viral serotype in foxes. Caution is warranted when interpreting these results because the sample size in this region was small (n = 10 for each species) and only samples from 4 foxes were successfully tested by using PRNTs, which revealed exposure to JCV. Increasing the number of fox samples tested with cELISA and PRNT would help identify what CSG viruses are present in northern Quebec.
Archived serum samples from western Hudson Bay polar bears provided a unique opportunity to monitor changes in exposure to CSG viruses and other pathogens (18) over time in one of the most rapidly warming Arctic regions in Canada. Exposure to CSG viruses in polar bears increased between 1986–1989 and 1995–1998 but did not continue to increase during 2015–2017 (Table 3). We found a strong positive association between air temperatures in the previous summer and virus exposure. Warmer air temperatures during summer when bears are on land likely increased the abundance of mosquitoes and bite exposures, especially in peatland ecosystems that are not moisture limited, overwhelming the influence of other climatic factors on CSG virus exposure. Summer air temperature and ice-free days did not increase from 1995–1998 to 2015–2017 (Appendix Table 2), which might explain the lack of continued increase in exposure to CSG viruses. However, because sea ice breakup in western Hudson Bay has been occurring ≈5–6 days earlier per decade (15,29) and temperatures continue to rise, polar bear exposures to vectorborne pathogens, including CSG viruses, will likely increase.
Summer segregation of polar bears by age and sex might partly explain why female and younger adult bears had higher CSG virus exposure. Hudson Bay is ice-free during the summer and fall, forcing polar bears onshore for 3–4 months; pregnant females are forced onshore for 8 months (38–40). While onshore, adult males are typically found in drier coastal areas, whereas adult females with cubs and pregnant females travel inland (39). The inland area consists of peatlands that are underlain by continuous permafrost resulting in poor drainage and extensive bogs and fens (41,42). Dens are constructed in peat deposits near water sources (41–44). Thus, proximity to stagnant water likely accounts for increased exposure of females and young bears to mosquito bites. Our study design limited the analysis to adult polar bears, and the age effect might have been more pronounced with the inclusion of younger animals.
Polar bears that were captured in Churchill were less likely to be exposed to CSG viruses, which is congruent with patterns of exposure to Francisella tularensis previously described (18). Similar to CSG viruses, the life cycle of F. tularensis involves transmission by biting insects (45). Churchill is on the Hudson Bay coast, and polar bears previously captured in town might be more likely to inhabit coastal areas that have reduced exposure to biting insects than polar bears found farther inland. These results suggest that persons in coastal regions of the Arctic have lower risk for arboviral exposure than those who live or travel inland.
Rodents and lagomorphs are theorized reservoirs for SSHV (5). However, all rodent samples tested during this study were negative for SSHV RNA, possibly caused by the short viremia duration typically associated with arboviral infections or by sample storage. For example, white-tailed deer (Odocoileus virginianus) had detectable JCV in the blood for only 2–4 days after inoculation (27). Thus, antibody rather than virus detection might be more practical for CSG virus surveillance, and hosts with larger blood volume (such as hares) might be better suited as sentinels for SSHV surveillance. However, serologic methods also introduce challenges. Results from repeatedly sampled caribou and polar bears suggest that antibodies might be relatively short-lived. In addition, 3 caribou seroconverted over winter, which suggests that false positives are possible.
All caribou samples from the NT tested by using PRNT had neutralizing antibodies against JCV, which was expected because white-tailed deer have been suggested as reservoir hosts for JCV in the United States and Canada (46,47). In Quebec, areas with moderate densities of white-tailed deer were associated with greater risk for human JCV seropositivity (48). Although exposure to JCV was expected, 4 caribou from the NT also had antibodies against SSHV, suggesting serologic cross-reactivity or exposure to both viruses.
Climate change, along with a deep cultural relationship between Indigenous persons and wildlife, suggests that northern Canada is an ideal location to study the effects of environmental variability on diseases that affect both human and animal health (49). This study demonstrated widespread distribution and regional differences in exposure to CSG viruses in wildlife of northern Canada across multiple ecosystems, highlighting the benefit of monitoring wildlife as sentinels for human disease risk. We identified high CSG virus seroprevalence in caribou populations, some of which are declining across northern Canada, emphasizing the need to determine whether caribou are reservoir hosts and whether JCV affects health and fecundity of these animals. Our finding of increased CSG virus seroprevalence in polar bears over time demonstrates the utility of comparing prevalence of climate sensitive diseases against baseline values for species known to be affected by rapid climate change (18,50). We identified summer air temperature as a key factor influencing polar bear exposure to CSG viruses, suggesting that infections will likely become more prevalent as the climate continues to change. Our study provides preliminary data for future surveillance of mosquitoborne viruses and highlights the need for continued studies to decipher the transmission dynamics of vectorborne diseases in regions experiencing substantial climate change. Future sustained surveillance of CSG and other arboviruses would provide additional information to measure health risks for humans and wildlife of conservation significance.
Ms. Buhler is a PhD candidate at the University of Saskatchewan. Her research interests include the epidemiology and ecology of zoonotic pathogens and focuses on vectorborne pathogen transmission in wildlife across northern ecosystems.
Acknowledgments
We thank the Hunters and Trappers Organization in Kugluktuk, regional and local Nunavimmi Umajulivijiit Katujaqatigininga (LNUK and RNUK), Makivik Corporation, Nunavik Research Centre, Faculté de Médecine Vétérinaire and Centre québécois sur la santé des animaux sauvages (CQSAS), Hunters and Trappers Organization in Cambridge Bay (Ekaluktutiak), Gjoa Haven (Oksoktok); Jack Skillings, Matilde Tomaselli, Dana Kellett; Susan Kutz and her laboratory team, especially Angie Schneider and James Wang, Marsha Branigan, Christine Menno, Verna Pokiak, Ève Lamontagne, Judy Williams, Kyle Russell, Kelsey Russell, Mike Suitor, Martin Keinzler, Maud Henaff; regional staff and the BC Wildlife Health program; staff and graduate students who collected polar bear samples as part of Environment and Climate Change Canada’s long-term research; Ian Stirling, Andrew Derocher, Dennis Andriashek, Bruce Rideout, Megan Owen, Megan Jones, and Courtney Loomer and Brooks Waitt for assistance with sample collection and storage, permit acquisition, or laboratory analyses.
Fox, rodent, and caribou work was supported by NSERC Discovery Grant and Northern Research Supplement (nos. NRS-2018-517969, RGPIN-2018-04900, and RGPIN-04171-2014), Weston Family Foundation, Northern Scientific Training Program, ArcticNet, Irving Maritime Shipbuilding/Nunavut Arctic College, and Polar Knowledge Canada (grant nos. NST-1718-0012 and NST-1718-0015). The long-term research at Karrak Lake, Nunavut, has been supported by Polar Continental Shelf Project, Central and Mississippi Flyway Councils, Canadian Wildlife Service, and Wildlife Research Division of Environment and Climate Change. Funding for caribou work was also provided by the Government of Yukon, Environment Climate Change Canada, and Parks Canada. Polar bear testing was funded by the McBeth Foundation. Financial and logistic support for fieldwork was provided by the Canadian Association of Zoos and Aquariums, Churchill Northern Studies Centre, Canadian Wildlife Federation, Care for the Wild International, Earth Rangers Foundation, Hauser Bears, the Isdell Family Foundation, Manitoba Sustainable Development, Natural Sciences and Engineering Research Council of Canada, Parks Canada Agency, Polar Bears International, Quark Expeditions, Schad Foundation, Wildlife Media Inc., and World Wildlife Fund (Canada).
Fox research was approved by the Government of Nunavut (permit nos. 2014-029, 2015-019, 2016-015, 2017-009, 2018-014, and 2019-03) and University of Saskatchewan Animal Research Ethics Board (approval nos. 20090159 and 19990029). Rodent trapping in Nunavut was approved under Government of Nunavut wildlife permits (nos. 2018-013 and 2019-016) and University of Saskatchewan Animal Research Ethics Board (approval no. 2011-0030 and 2019-0021). Rodent and shrew trapping in the NT was approved under permit NWTWCC 2021-001 (live-trapping) and NWTWCC 2021-002 (snap-trapping). Polar bear research was approved under Government of Manitoba wildlife research permits (nos. SAR14010 and SAR20663), Parks Canada Agency wildlife research and collection permits (nos. WAP-2014-17039 and WAP-2017-26059), and Environment and Climate Change Canada Western and Northern Animal Care Committee protocol approvals (nos. 15NL01, 16NL01, and 17NL01). BC caribou samples were collected under Wildlife Act permits (nos. FJ14-93094, FJ18-421458, FJ19-426636, FJ21-618702, and PG17-284065). Yukon caribou samples were also collected under the Wildlife Act (exemption for Yukon Government staff) and protocols were approved by the Yukon Government Wildlife Care Committee. All animal use adhered to the Canadian Council on Animal Care guidelines for humane animal use (https://ccac.ca/en/standards/guidelines).
References
- Hoberg EP, Brooks DR. Evolution in action: climate change, biodiversity dynamics and emerging infectious disease. Philos Trans R Soc Lond B Biol Sci. 2015;370:
20130553 . DOIPubMedGoogle Scholar - Zhang X, Flato G, Kirchmeier-Young M, Vincent L, Wan H, Wang X, et al. Changes in temperature and precipitation across Canada. In: Bush E, Lemmen DS, editors. Canada’s changing climate report. Ottawa (ON, Canada): Government of Canada; 2019. p. 112–93.
- Bintanja R. The impact of Arctic warming on increased rainfall. Sci Rep. 2018;8:16001. DOIPubMedGoogle Scholar
- Grace J, Berninger F, Nagy L. Impacts of climate change on the tree line. Ann Bot. 2002;90:537–44. DOIPubMedGoogle Scholar
- Drebot MA. Emerging mosquito-borne bunyaviruses in Canada. Can Commun Dis Rep. 2015;41:117–23. DOIPubMedGoogle Scholar
- Hughes HR, Lanciotti RS, Blair CD, Lambert AJ. Full genomic characterization of California serogroup viruses, genus Orthobunyavirus, family Peribunyaviridae including phylogenetic relationships. Virology. 2017;512:201–10. DOIPubMedGoogle Scholar
- Meier-Stephenson V, Langley JM, Drebot M, Artsob H. Encephalitis in the summer: a case of snowshoe hare (California serogroup) virus infection in Nova Scotia. Can Commun Dis Rep. 2007;33:23–6.PubMedGoogle Scholar
- LeDuc JW. Epidemiology and ecology of the California serogroup viruses. Am J Trop Med Hyg. 1987;37(Suppl):60S–8S. DOIPubMedGoogle Scholar
- Vosoughi R, Walkty A, Drebot MA, Kadkhoda K. Jamestown Canyon virus meningoencephalitis mimicking migraine with aura in a resident of Manitoba. CMAJ. 2018;190:E262–4. DOIPubMedGoogle Scholar
- Miernyk KM, Bruden D, Parkinson AJ, Hurlburt D, Klejka J, Berner J, et al. Human seroprevalence to 11 zoonotic pathogens in the U.S. Arctic, Alaska. Vector Borne Zoonotic Dis. 2019;19:563–75. DOIPubMedGoogle Scholar
- Villeneuve CA, Buhler KJ, Iranpour M, Avard E, Dibernardo A, Fenton H, et al. New records of California serogroup viruses in Aedes mosquitoes and first detection in simulioidae flies from Northern Canada and Alaska. Polar Biol. 2021;44:1911–5. DOIGoogle Scholar
- McCall AG, Derocher AE, Lunn NJ. Home range distribution of polar bears in western Hudson Bay. Polar Biol. 2015;38:343–55. DOIGoogle Scholar
- Buhler KJ, Maggi RG, Gailius J, Galloway TD, Chilton NB, Alisauskas RT, et al. Hopping species and borders: detection of Bartonella spp. in avian nest fleas and arctic foxes from Nunavut, Canada. Parasit Vectors. 2020;13:469. DOIPubMedGoogle Scholar
- Chevallier C, Gauthier G, Berteaux D. Age estimation of live arctic foxes Vulpes lagopus based on teeth condition. Wildl Biol. 2017;2017:1–6. DOIGoogle Scholar
- Lunn NJ, Servanty S, Regehr EV, Converse SJ, Richardson E, Stirling I. Demography of an apex predator at the edge of its range: impacts of changing sea ice on polar bears in Hudson Bay. Ecol Appl. 2016;26:1302–20. DOIPubMedGoogle Scholar
- Stirling I, Spencer C, Andriashek D. Immobilization of polar bears (Ursus maritimus) with Telazol in the Canadian Arctic. J Wildl Dis. 1989;25:159–68. DOIPubMedGoogle Scholar
- Calvert W, Ramsay MA. Evaluation of age determination of polar bears by counts of cementum growth layer groups. Ursus. 1998;10:449–53.
- Pilfold NW, Richardson ES, Ellis J, Jenkins E, Scandrett WB, Hernández-Ortiz A, et al. Long-term increases in pathogen seroprevalence in polar bears (Ursus maritimus) influenced by climate change. Glob Change Biol. 2021;27:4481–97. DOIPubMedGoogle Scholar
- Rocheleau JP, Michel P, Lindsay LR, Drebot M, Dibernardo A, Ogden NH, et al. Emerging arboviruses in Quebec, Canada: assessing public health risk by serology in humans, horses and pet dogs. Epidemiol Infect. 2017;145:2940–8. DOIPubMedGoogle Scholar
- Beaty BJ, Calisher CH, Shope RS. Arboviruses. In: Schmidt NJ, Emmons RW, editors. Diagnostic procedures for viral, rickettsial and chlamydial Infections. Washington: American Public Health Association; 1989. p. 797–856.
- Sergeant ESG. Epitools epidemiological calculators. Ausvet, 2019 [cited 2021 Aug 15]. https://epitools.ausvet.com.au
- Stirling I, Thiemann GW, Richardson E. Quantitative support for a subjective fatness index for immobilized polar bears. J Wildl Manage. 2008;72:568–74. DOIGoogle Scholar
- Thiemann GW, Lunn NJ, Richardson ES, Andriashek DS. Temporal change in the morphometry–body mass relationship of polar bears. J Wildl Manage. 2011;75:580–7. DOIGoogle Scholar
- Towns L, Derocher AE, Stirling I, Lunn NJ, Hedman D. Spatial and temporal patterns of problem polar bears in Churchill, Manitoba. Polar Biol. 2009;32:1529–37. DOIGoogle Scholar
- Cavalieri DJ, Parkinson CL, Gloersen P, Zwally HJ. Sea ice concentrations from Nimbus-7 SMMR and DMSP SSM/I-SSMIS passive microwave data, version 1. Boulder (CO): NASA National Snow and Ice Data Center Distributed Active Archive Center; 1996. DOIGoogle Scholar
- Government of Canada. Historical Data. National Climate Data and Information Archive [cited 2020 Feb 23]. https://climate.weather.gc.ca/historical_data/search_historic_data_e.html
- Watts DM, Tammariello RF, Dalrymple JM, Eldridge BF, Russell PK, Top FH Jr. Experimental infection of vertebrates of the Pocomoke Cypress Swamp, Maryland with Keystone and Jamestown Canyon viruses. Am J Trop Med Hyg. 1979;28:344–50. DOIPubMedGoogle Scholar
- Corbet PS, Downe AER. Natural hosts of mosquitoes in northern Ellesmere Island. Arctic. 1966;19:153–61. DOIGoogle Scholar
- Castro de la Guardia L, Myers PG, Derocher AE, Lunn NJ, Terwisscha van Scheltinga AD. Sea ice cycle in western Hudson Bay, Canada, from a polar bear perspective. Mar Ecol Prog Ser. 2017;564:225–33. DOIGoogle Scholar
- Culler LE, Ayres MP, Virginia RA. In a warmer Arctic, mosquitoes avoid increased mortality from predators by growing faster. Proc Biol Sci. 2015;282:
20151549 . DOIPubMedGoogle Scholar - Corbet PS, Danks HV. Egg-laying habits of mosquitoes in the high Arctic. Mosq News. 1975;35:8–14.
- Vincent LA, Zhang X, Brown RD, Feng Y, Mekis E, Milewska EJ, et al. Observed trends in Canada’s climate and influence of low-frequency variability modes. J Clim. 2015;28:4545–60. DOIGoogle Scholar
- Ogden NH, Lindsay LR, Ludwig A, Morse AP, Zheng H, Zhu H. Weather-based forecasting of mosquito-borne disease outbreaks in Canada. Can Commun Dis Rep. 2019;45:127–32. DOIPubMedGoogle Scholar
- Seip DR, Cichowski DB. Population ecology of caribou in British Columbia. Rangifer. 1996;16:73–80. DOIGoogle Scholar
- Bergerud AT. Caribou. In: Davis DE, editor. CRC handbook of census methods for terrestrial vertebrates, 1st ed. Boca Raton (LA): CRC Press; 1982. p. 268–270
- Downes CM, Theberge JB, Smith SM. The influence of insects on the distribution, microhabitat choice, and behaviour of the Burwash caribou herd. Can J Zool. 1986;64:622–9. DOIGoogle Scholar
- Stirling I, Jonkel C, Smith P, Robertson R, Cross D. The ecology of the polar bear (Ursus maritimus) along the western coast of Hudson Bay. Canadian Wildlife Service, occasional paper no. 33, 1977 [cited 2021 Oct 20]. https://publications.gc.ca/collections/collection_2018/eccc/CW69-1-33-eng.pdf
- Derocher AE, Stirling I. Distribution of polar bears (Ursus maritimus) during the ice-free period in western Hudson Bay. Can J Zool. 1990;68:1395–403. DOIGoogle Scholar
- Peacock E, Derocher AE, Lunn NJ, Obbard ME. Polar bear ecology and management in Hudson Bay in the face of climate change. In: Ferguson SH, Loseto LL, Mallory ML, editors. A little less Arctic. Dordrecht (the Netherlands): Springer-Verlag; 2010. p. 93–116.
- Ritchie JC. The vegetation of northern Manitoba. V. Establishing the major zonation. Arctic. 1960;13:210–29. DOIGoogle Scholar
- Brook RK. Structure and dynamics of the vegetation in Wapusk National Park and the Cape Churchill Wildlife Management Area of Manitoba, community and landscape scales [master’s thesis]. Winnipeg (MN, Canada): University of Manitoba; 2001.
- Clark DA, Stirling I, Calvert W. Distribution, characteristics, and use of earth dens and related excavations by polar bears on the western Hudson Bay lowlands. Arctic. 1997;50:158–66. DOIGoogle Scholar
- Richardson E, Stirling I, Hik DS. Polar bear (Ursus maritimus) maternity denning habitat in western Hudson Bay: a bottom-up approach to resource selection functions. Can J Zool. 2005;83:860–70. DOIGoogle Scholar
- Hollis-Etter KM, Montgomery RA, Etter DR, Anchor CL, Chelsvig JE, Warner RE, et al. Environmental conditions for Jamestown Canyon virus correlated with population-level resource selection by white-tailed deer in a suburban landscape. PLoS One. 2019;14:
e0223582 . DOIPubMedGoogle Scholar - Patriquin G, Drebot M, Cole T, Lindsay R, Schleihauf E, Johnston BL, et al. High seroprevalence of Jamestown Canyon virus among deer and humans, Nova Scotia, Canada. Emerg Infect Dis. 2018;24:118–21. DOIPubMedGoogle Scholar
- Rocheleau JP, Michel P, Lindsay LR, Drebot M, Dibernardo A, Ogden NH, et al. Risk factors associated with seropositivity to California serogroup viruses in humans and pet dogs, Quebec, Canada. Epidemiol Infect. 2018;146:1167–76. DOIPubMedGoogle Scholar
- Dudley JP, Hoberg EP, Jenkins EJ, Parkinson AJ. Climate Change in the North American Arctic: A One Health Perspective. EcoHealth. 2015;12:713–25. DOIPubMedGoogle Scholar
- Fuglei E, Ims RA. Global warming and effects on the Arctic fox. Sci Prog. 2008;91:175–91. DOIPubMedGoogle Scholar
Figure
Tables
Cite This ArticleOriginal Publication Date: December 15, 2022
Table of Contents – Volume 29, Number 1—January 2023
| EID Search Options |
|---|
|
|
|
|
|
|
Please use the form below to submit correspondence to the authors or contact them at the following address:
Kayla J. Buhler, Department of Veterinary Microbiology, Western College of Veterinary Medicine, 52 Campus Dr, Saskatoon, SK S7N 5B4, Canada
Top