Skip directly to site content Skip directly to page options Skip directly to A-Z link Skip directly to A-Z link Skip directly to A-Z link
Volume 29, Number 1—January 2023
Research

Integrating Citizen Scientist Data into the Surveillance System for Avian Influenza Virus, Taiwan

Hong-Dar Isaac Wu, Ruey-Shing Lin, Wen-Han Hwang, Mei-Liang Huang, Bo-Jia Chen, Tseng-Chang Yen, and Day-Yu ChaoComments to Author 
Author affiliations: National Chung Hsing University, Taichung, Taiwan (H.-D.I. Wu, W.-H. Hwang, M.-L. Huang, B.-J. Chen, T.-C. Yen, D.-Y. Chao); Taiwan Endemic Species Research Institute, Jiji Town, Taiwan (R.S. Lin)

Main Article

Figure 4

Land cover and bird distribution data for study of integrating citizen scientist data into the surveillance system for avian influenza virus, Taiwan. A) Percentages of 9 land-cover types in the total area of Taiwan main island (bars), area of poultry farms in the total area of indicated land-cover types (line). B, C) The clustering pattern of the area of each land-cover type (B) and the propensity score for each bird species from 3,764 grids partitioned by 3-km × 3-km squares of the main island of Taiwan (C), are based on principal component analysis and tSNE dimension reduction. Clusters are colored by the land-cover type as shown in panel A. For 4,762 grids, if 1 specific land-cover type is composed of >90% in the grid, such grid will be regarded as such specific land-cover type. Otherwise, it will be labeled as the mixed land-cover type. The labels of clusters in panels B and C are consistent with those in panel A. FF, farm field; FO, forest; FW, farm wetland; MD, meadow; mix, mixed land-cover types; tSNE, t-distributed stochastic neighbor embedding UB, urban; WB, water body.

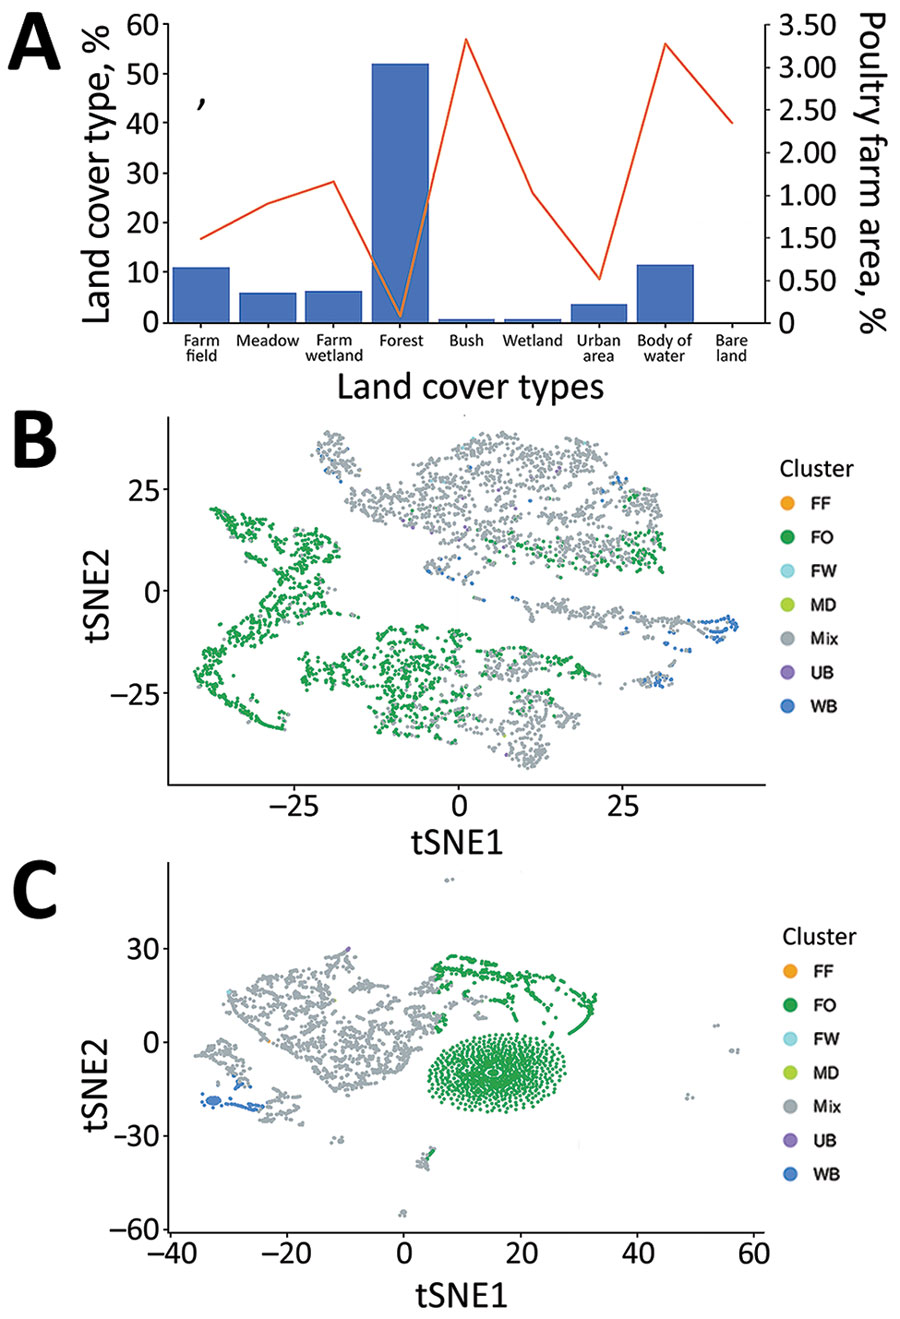
Figure 4. Land cover and bird distribution data for study of integrating citizen scientist data into the surveillance system for avian influenza virus, Taiwan. A) Percentages of 9 land-cover types in the total area of Taiwan main island (bars), area of poultry farms in the total area of indicated land-cover types (line). B, C) The clustering pattern of the area of each land-cover type (B) and the propensity score for each bird species from 3,764 grids partitioned by 3-km × 3-km squares of the main island of Taiwan (C), are based on principal component analysis and tSNE dimension reduction. Clusters are colored by the land-cover type as shown in panel A. For 4,762 grids, if 1 specific land-cover type is composed of >90% in the grid, such grid will be regarded as such specific land-cover type. Otherwise, it will be labeled as the mixed land-cover type. The labels of clusters in panels B and C are consistent with those in panel A. FF, farm field; FO, forest; FW, farm wetland; MD, meadow; mix, mixed land-cover types; tSNE, t-distributed stochastic neighbor embedding UB, urban; WB, water body.

Main Article

Page created: November 30, 2022
Page updated: December 21, 2022
Page reviewed: December 21, 2022
The conclusions, findings, and opinions expressed by authors contributing to this journal do not necessarily reflect the official position of the U.S. Department of Health and Human Services, the Public Health Service, the Centers for Disease Control and Prevention, or the authors' affiliated institutions. Use of trade names is for identification only and does not imply endorsement by any of the groups named above.
file_external