Skip directly to site content Skip directly to page options Skip directly to A-Z link Skip directly to A-Z link Skip directly to A-Z link
Volume 29, Number 1—January 2023
Research

Human Immunity and Susceptibility to Influenza A(H3) Viruses of Avian, Equine, and Swine Origin

Elien Vandoorn, Wojciech Stadejek, Isabel Leroux-Roels, Geert Leroux-Roels, Anna Parys, and Kristien Van ReethComments to Author 
Author affiliations: Ghent University, Merelbeke, Belgium (E. Vandoorn, W. Stadejek, A. Parys, K. Van Reeth); Ghent University and Ghent University Hospital, Ghent, Belgium (I. Leroux-Roels, G. Leroux-Roels)

Main Article

Figure 4

Replication kinetics of influenza A(H3) viruses of different species in human airway epithelia (MucilAir; Epithelix Sàrl, https://www.epithelix.com). Tissues were infected with viruses at a multiplicity of infection of 0.01 TCID50, and supernatants were collected at different days postinfection for virus titration in MDCK cells. A–C) Virus replication in nasal tissue of donors ND1 (A), ND2 (B), and ND3 (C). D) Virus yield in nasal tissues. E–G) Virus replication in bronchial tissue of donors BD1 (E), BD2 (F), and BD3 (G). H) Virus yield in bronchial tissues. Virus yield in panels D and H was determined by calculating the area under the curve at 1–4 dpi; letters indicate significant differences (p<0.1): mock (a), swG17 (b), swIN16 (c), or HK68 (d). Black dashed lines represent detection limit. Complete isolate names are provided in Table 2. TCID50, 50% tissue culture infectious dose.

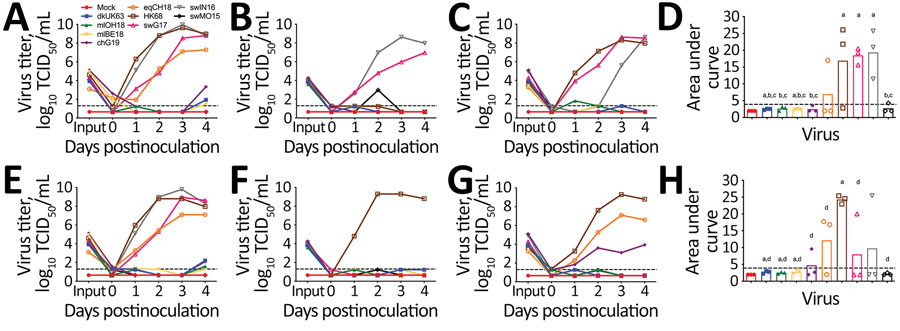
Figure 4. Replication kinetics of influenza A(H3) viruses of different species in human airway epithelia (MucilAir; Epithelix Sàrl, https://www.epithelix.com). Tissues were infected with viruses at a multiplicity of infection of 0.01 TCID50, and supernatants were collected at different days postinfection for virus titration in MDCK cells. A–C) Virus replication in nasal tissue of donors ND1 (A), ND2 (B), and ND3 (C). D) Virus yield in nasal tissues. E–G) Virus replication in bronchial tissue of donors BD1 (E), BD2 (F), and BD3 (G). H) Virus yield in bronchial tissues. Virus yield in panels D and H was determined by calculating the area under the curve at 1–4 dpi; letters indicate significant differences (p<0.1): mock (a), swG17 (b), swIN16 (c), or HK68 (d). Black dashed lines represent detection limit. Complete isolate names are provided in [[ANCHOR###T2###Table 2###Anchor]]. TCID50, 50% tissue culture infectious dose.

Main Article

Page created: November 30, 2022
Page updated: December 21, 2022
Page reviewed: December 21, 2022
The conclusions, findings, and opinions expressed by authors contributing to this journal do not necessarily reflect the official position of the U.S. Department of Health and Human Services, the Public Health Service, the Centers for Disease Control and Prevention, or the authors' affiliated institutions. Use of trade names is for identification only and does not imply endorsement by any of the groups named above.
file_external